SBS News
SK Hynix Made Over 60 Trillion Won and Samsung Over 89 Trillion... Why Are Stocks Falling?
Published : Jul 31, 2026 9:04 AM
[OhGraph]

⚡ SBS Premium Key Takeaways
The sharp fall in stock prices for Samsung Electronics and SK Hynix despite record earnings can be attributed to the domestic stock market's heavy concentration in semiconductor companies and mechanical selling pressure driven by single-stock leveraged ETFs.
Meanwhile, the V-KOSPI index, which measures the volatility of the KOSPI, has surged to levels seen during the 2008 financial crisis, diverging from the trend in U.S. stock markets.
Although China's Moonshot AI added uncertainty to the semiconductor market by releasing its high-performance AI model K-3, some view that the expanded data center demand resulting from increased AI model efficiency could ultimately benefit chipmakers in the long run.
July is the season when major domestic and foreign companies roll out their second-quarter earnings reports one after another. However, something quite strange is happening. While corporate earnings are reaching record highs, the market is not reacting accordingly. Stocks rise by a trickle when they gain, but plunge heavily when they fall. Among them, the volatility of the South Korean stock market has been particularly severe, causing no small amount of stress for investors. In today's OhGraph, we will examine the earnings of major semiconductor companies and recent market volatility through various data and charts.
Record-Shattering Earnings, So Why Are Stock Prices Dropping?
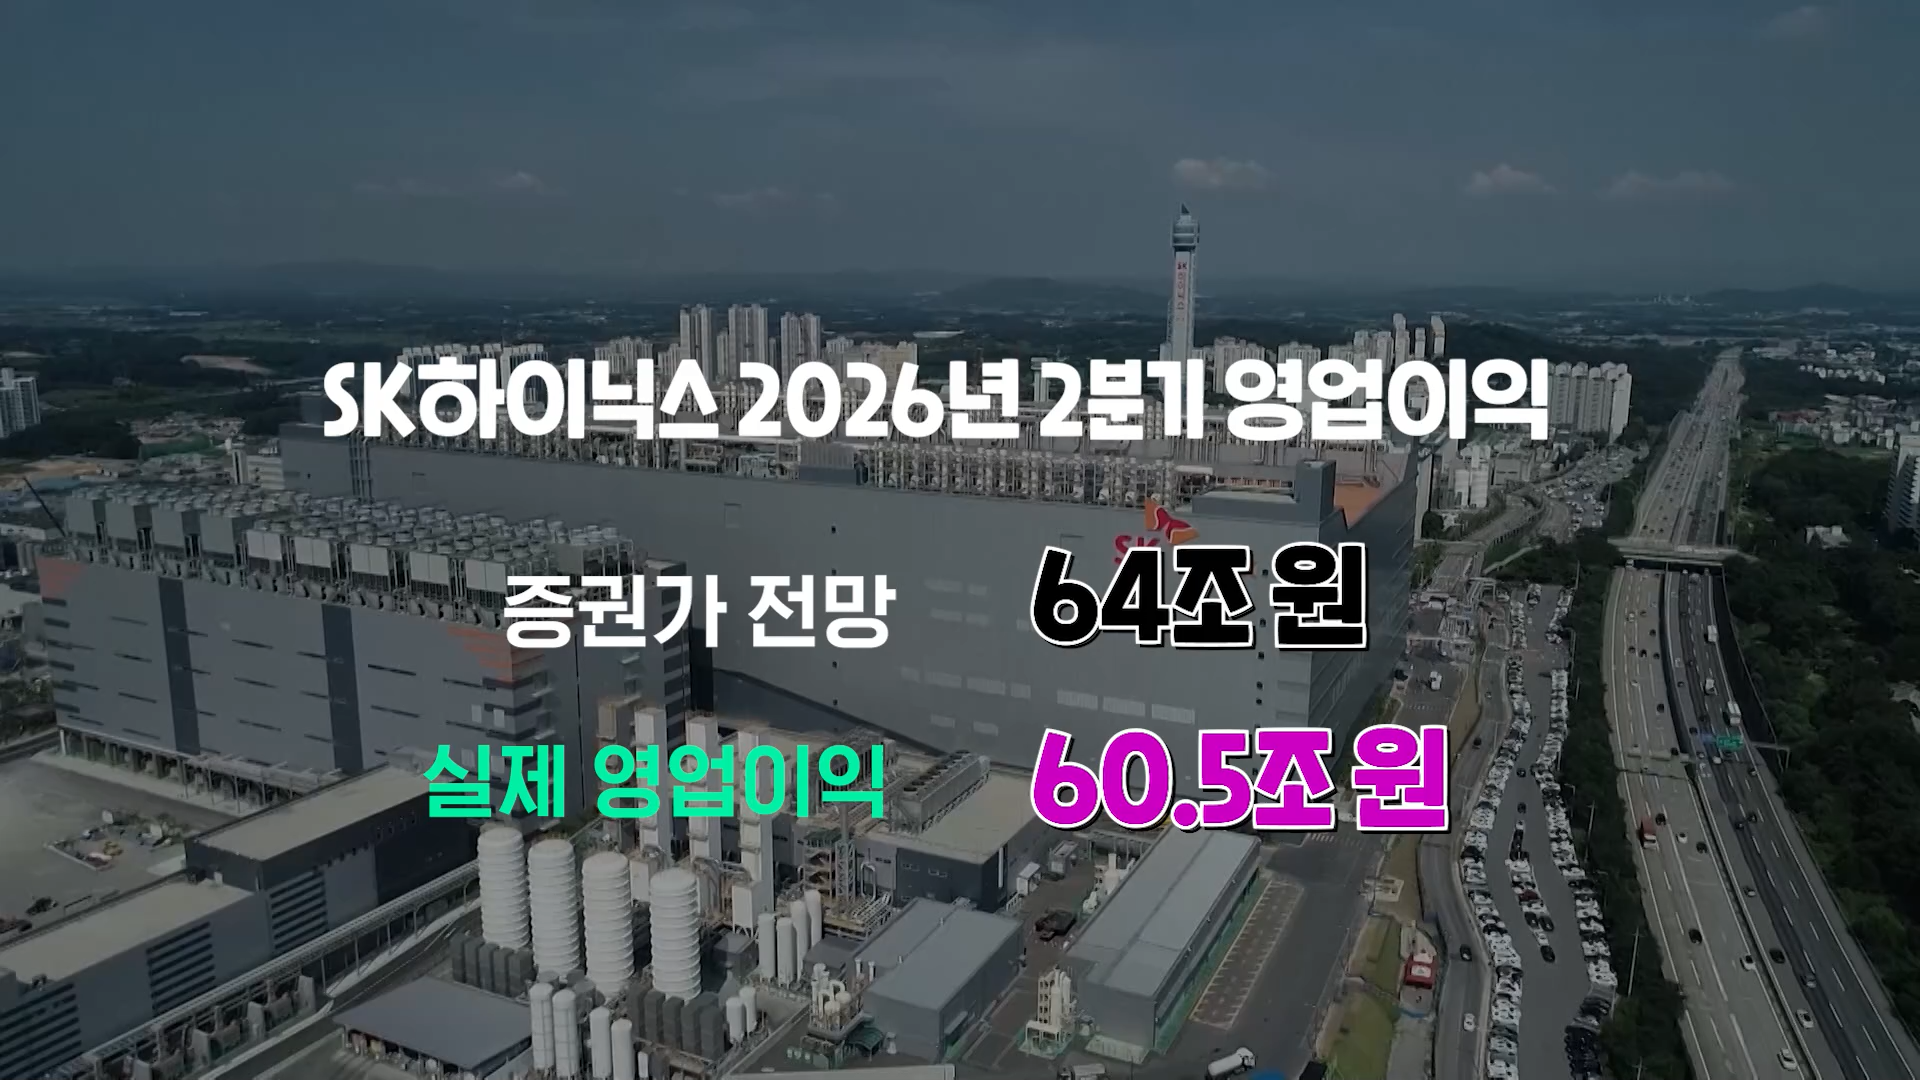
On July 29, SK Hynix announced its second-quarter earnings. Securities firms had estimated SK Hynix's operating profit at around 64 trillion won, but the actual figure came in at 60.5 trillion won. While the operating profit figure itself is impressive, what is particularly noteworthy is the operating profit margin. The operating profit margin indicates operating profit relative to revenue—one of the key metrics used to assess a company's underlying profitability and operational efficiency. In the first quarter, SK Hynix recorded a staggering operating profit margin of 71.5%. This time, it surpassed that figure to hit 76.3%.
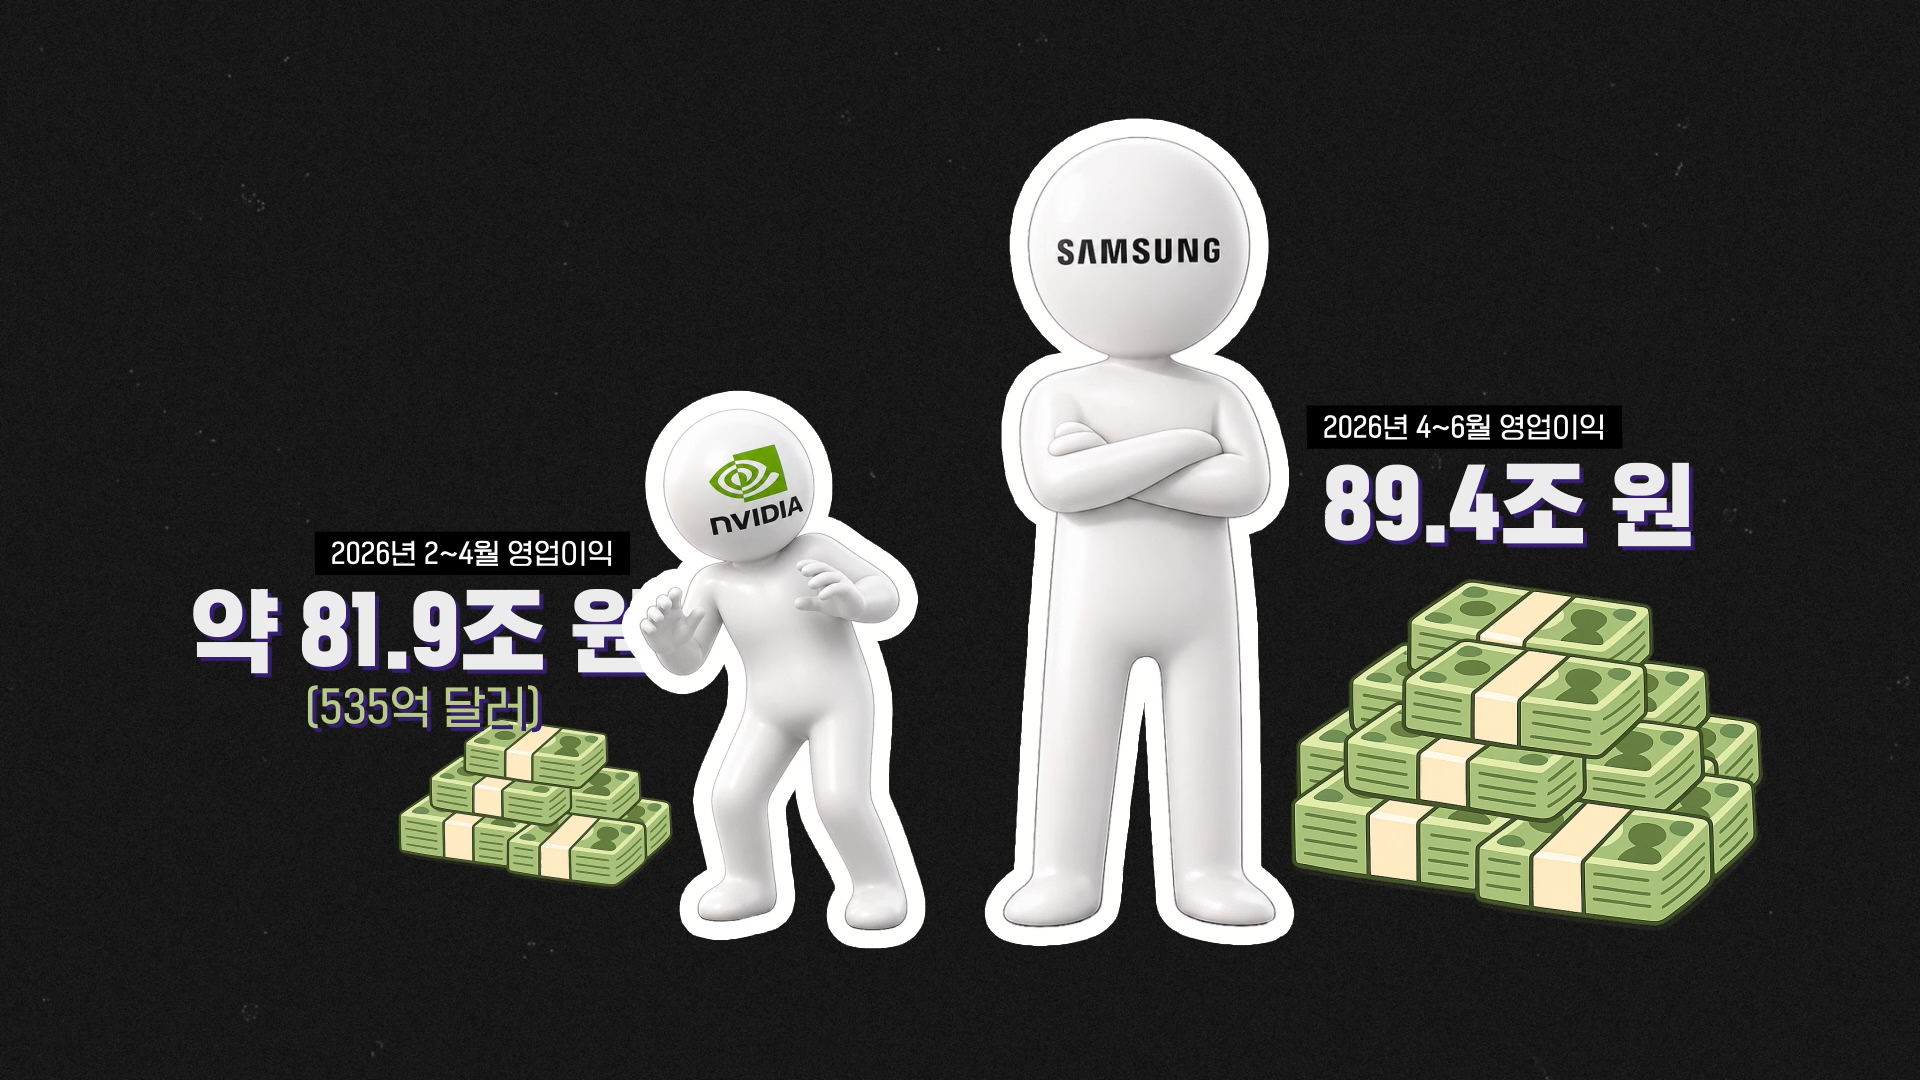
On July 7, Samsung Electronics announced a second-quarter operating profit of a staggering 89.4 trillion won. When asking which company earned the most money in the world, the answer was neither Nvidia, Google, nor Apple, but South Korea's Samsung Electronics. Let's look at the chart to see just how remarkable this figure is.
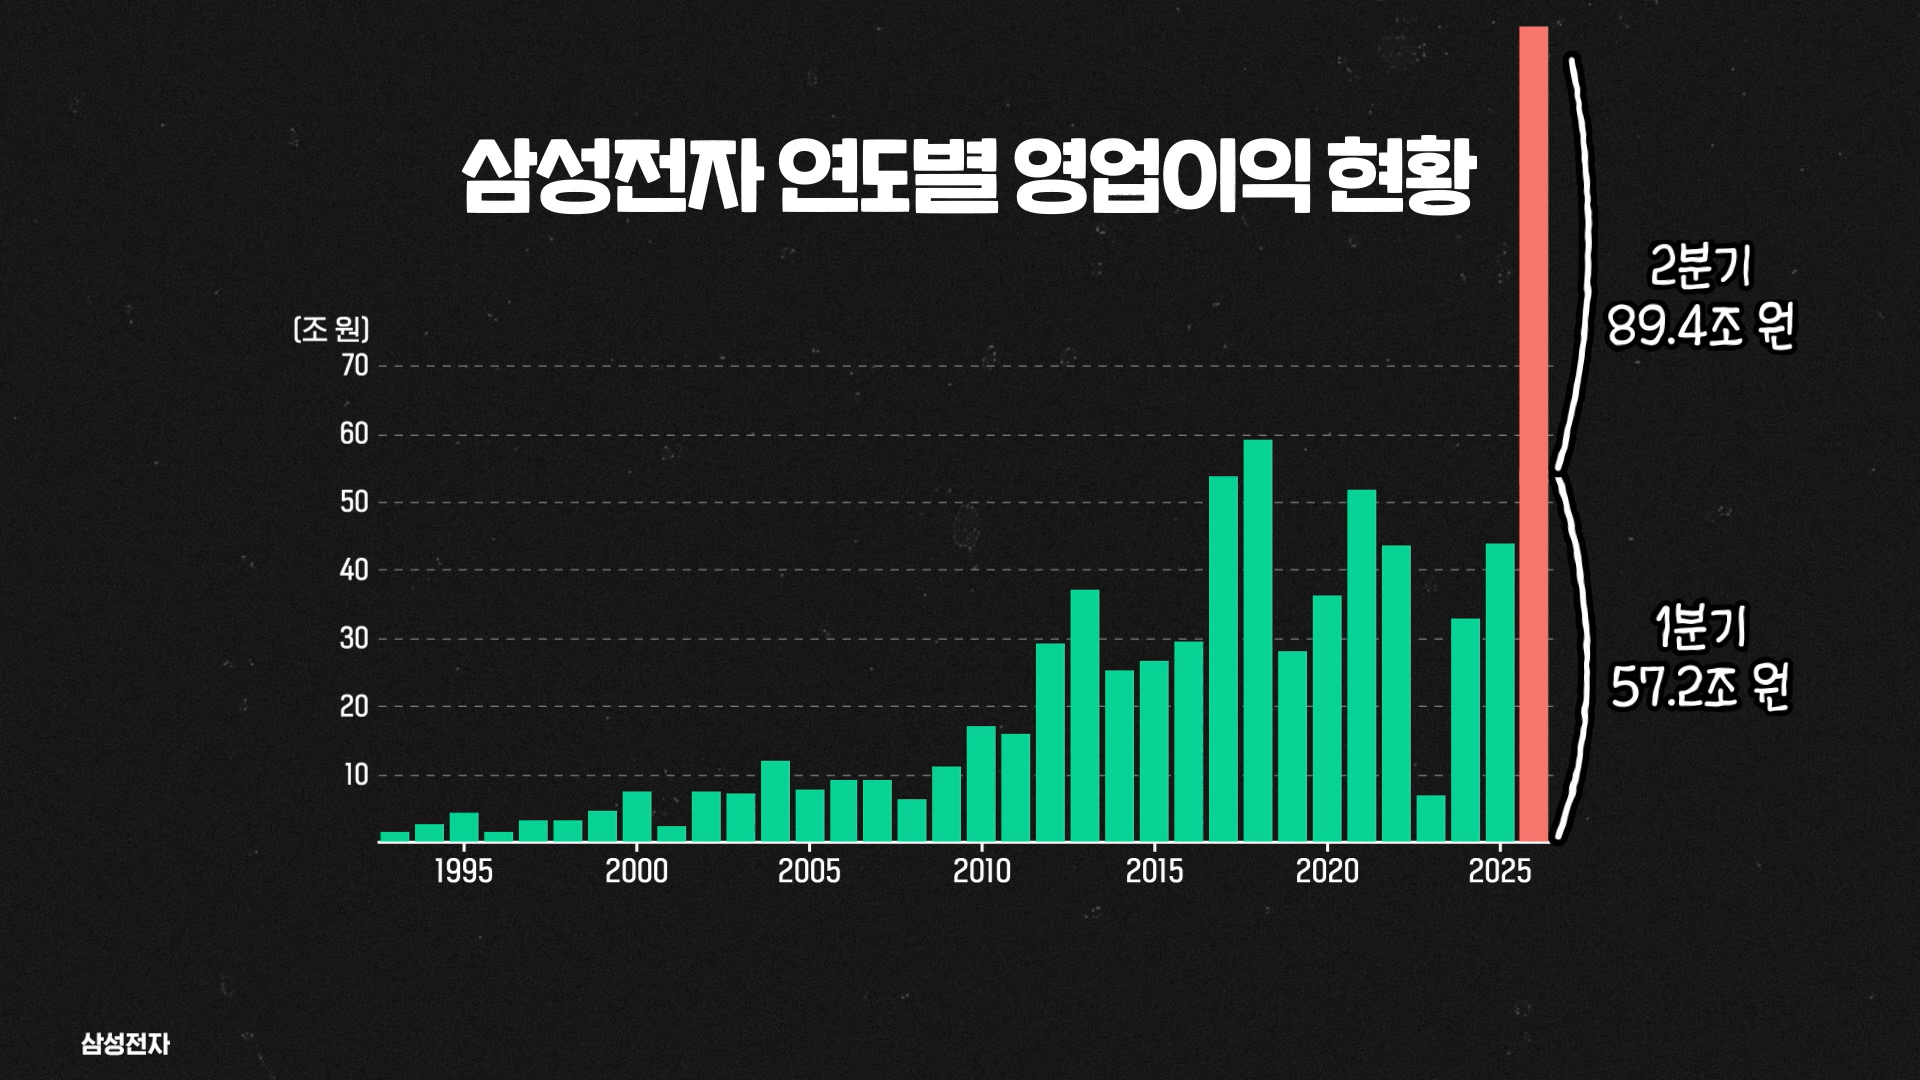
Unsurprisingly, this figure represents the most overwhelmingly high operating profit in Samsung Electronics' history. We charted Samsung Electronics' operating profit from 1993—when late Chairman Lee Kun-hee delivered his famous New Management Declaration urging employees to "change everything except your wife and children"—to the present.
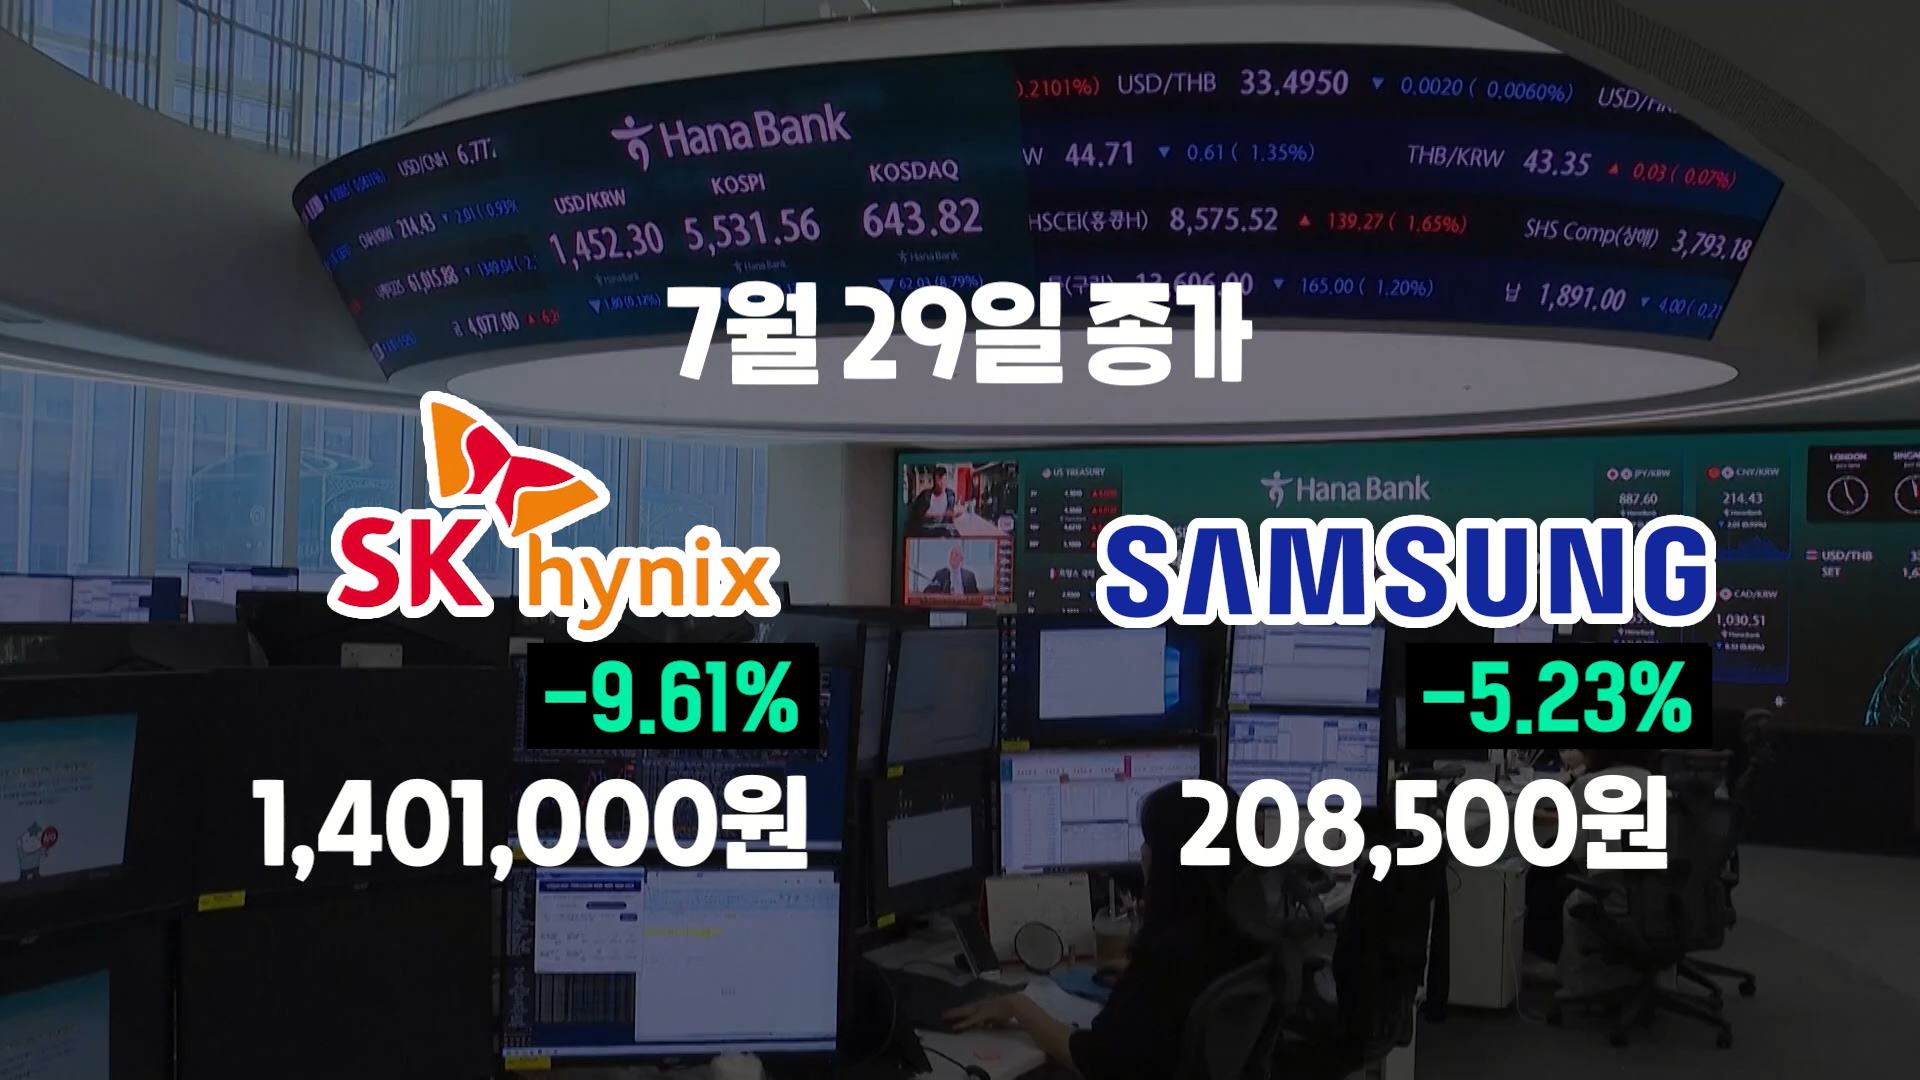
Despite posting such stellar earnings, Samsung Electronics' stock price slid sharply at the time, dropping nearly 10% at one point before closing down 6.9%. The decline was not limited to Samsung Electronics; SK Hynix followed a similar path, and circuit breakers were even triggered on the KOSPI to temporarily halt trading.
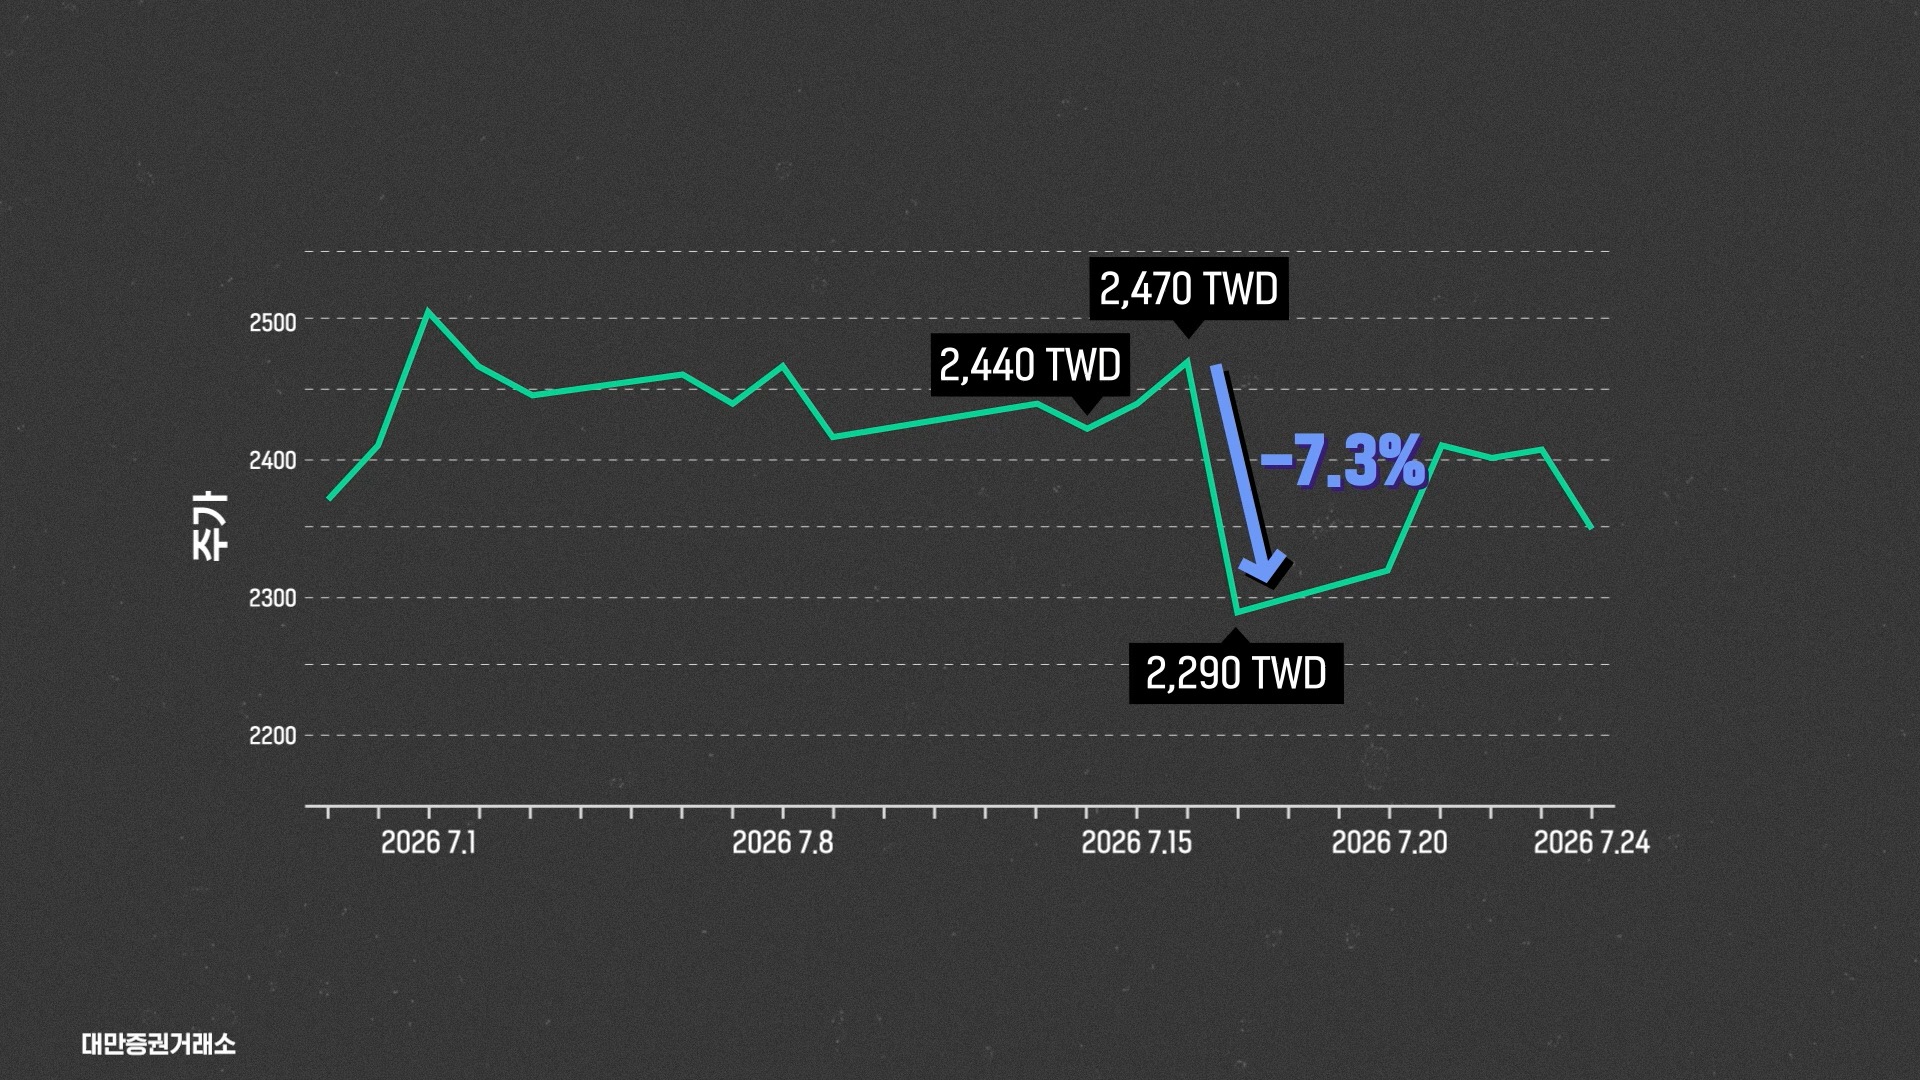
In fact, stock prices falling despite earnings surprises is not a phenomenon unique to the domestic market. On July 16, TSMC announced its second-quarter earnings, reporting an operating profit of 766.6 billion New Taiwan dollars (approximately 35.3 trillion won). Although this marked a 65.4% increase year-on-year, TSMC's stock price moved in the opposite direction.
If Anyone Asks About Volatility, Tell Them to Look at the South Korean Market
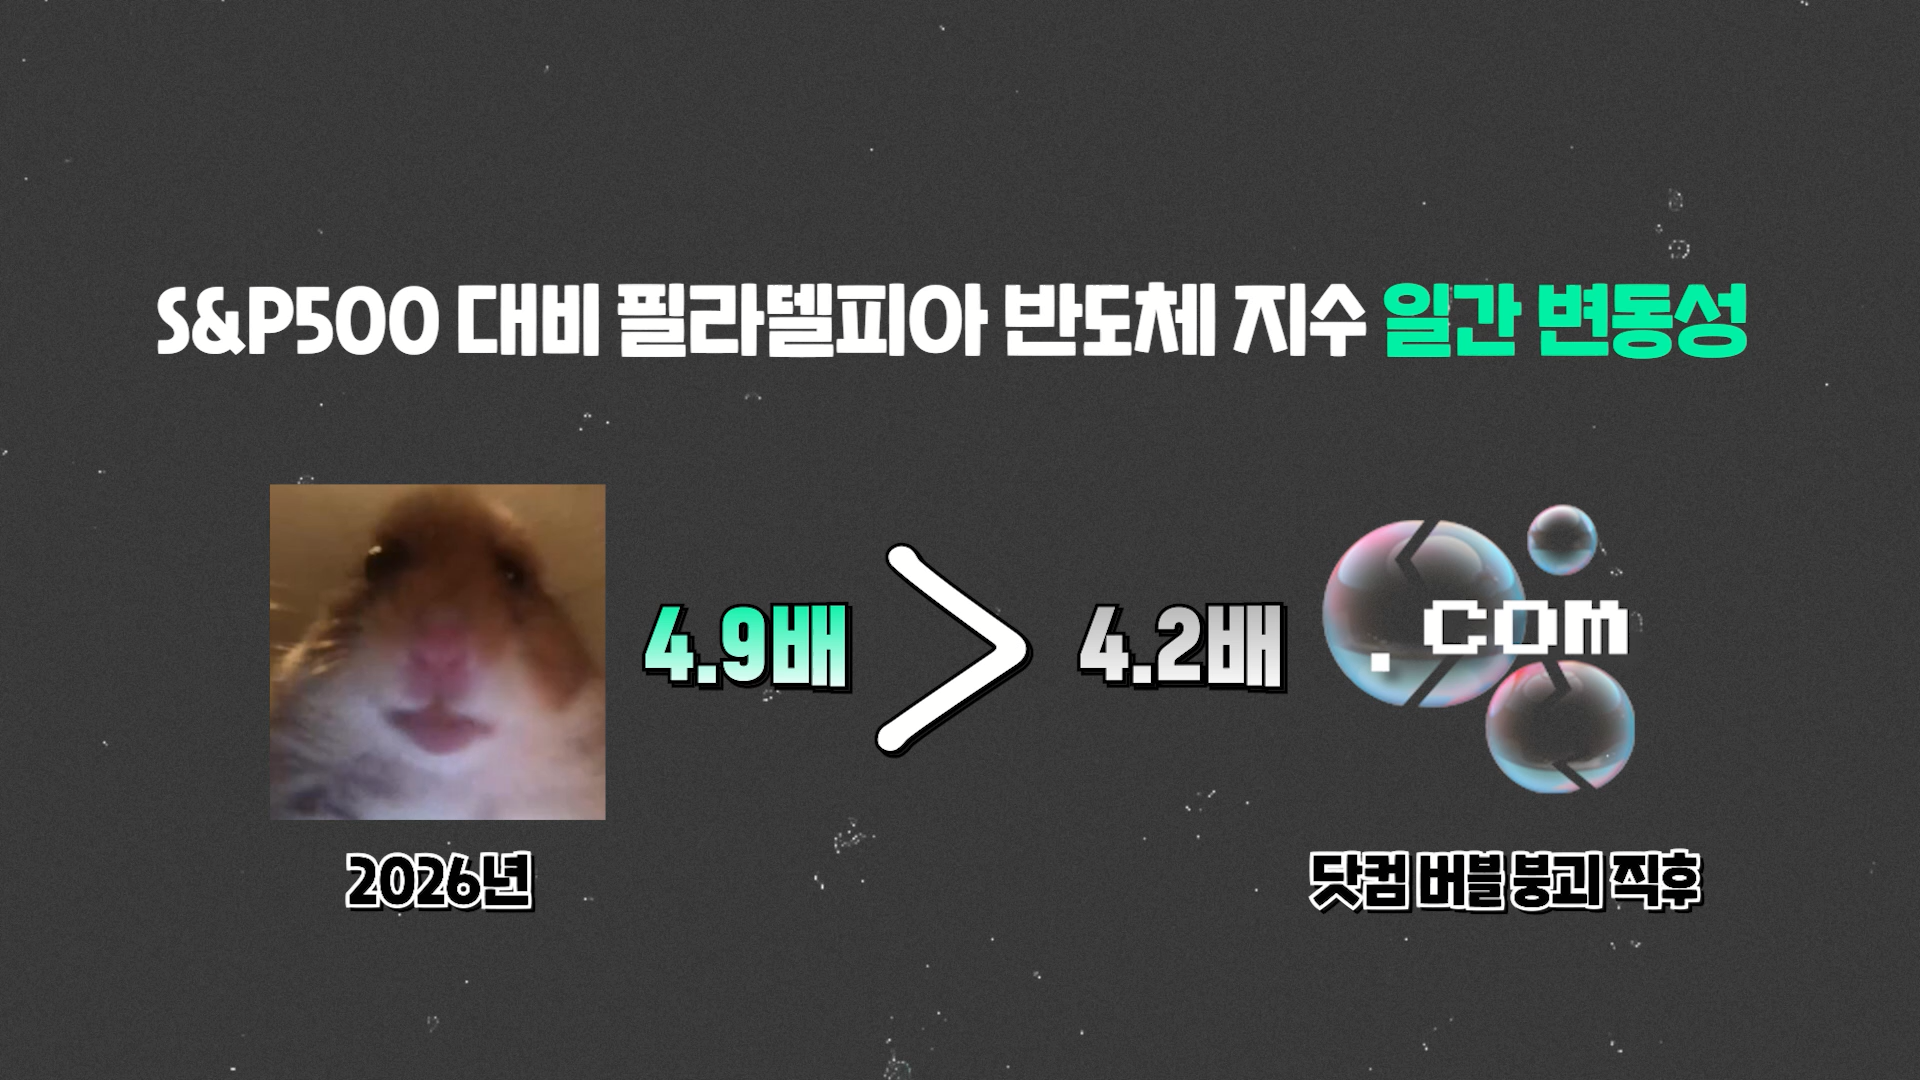
As markets continue to sway despite semiconductor companies reporting extraordinary earnings, many investors are feeling the pain. According to an analysis by the Financial Times, the daily volatility of the Philadelphia Semiconductor Index in the United States recently reached 4.9 times that of the S&P 500. This figure is even higher than the 4.2 times recorded immediately following the collapse of the dot-com bubble in 2000.
Since breaking the 9,000-point threshold, volatility has escalated dramatically, to the point where sidecars—which temporarily suspend program trading—have become a daily occurrence. Let's look at the chart to see how frequently sidecars were triggered.
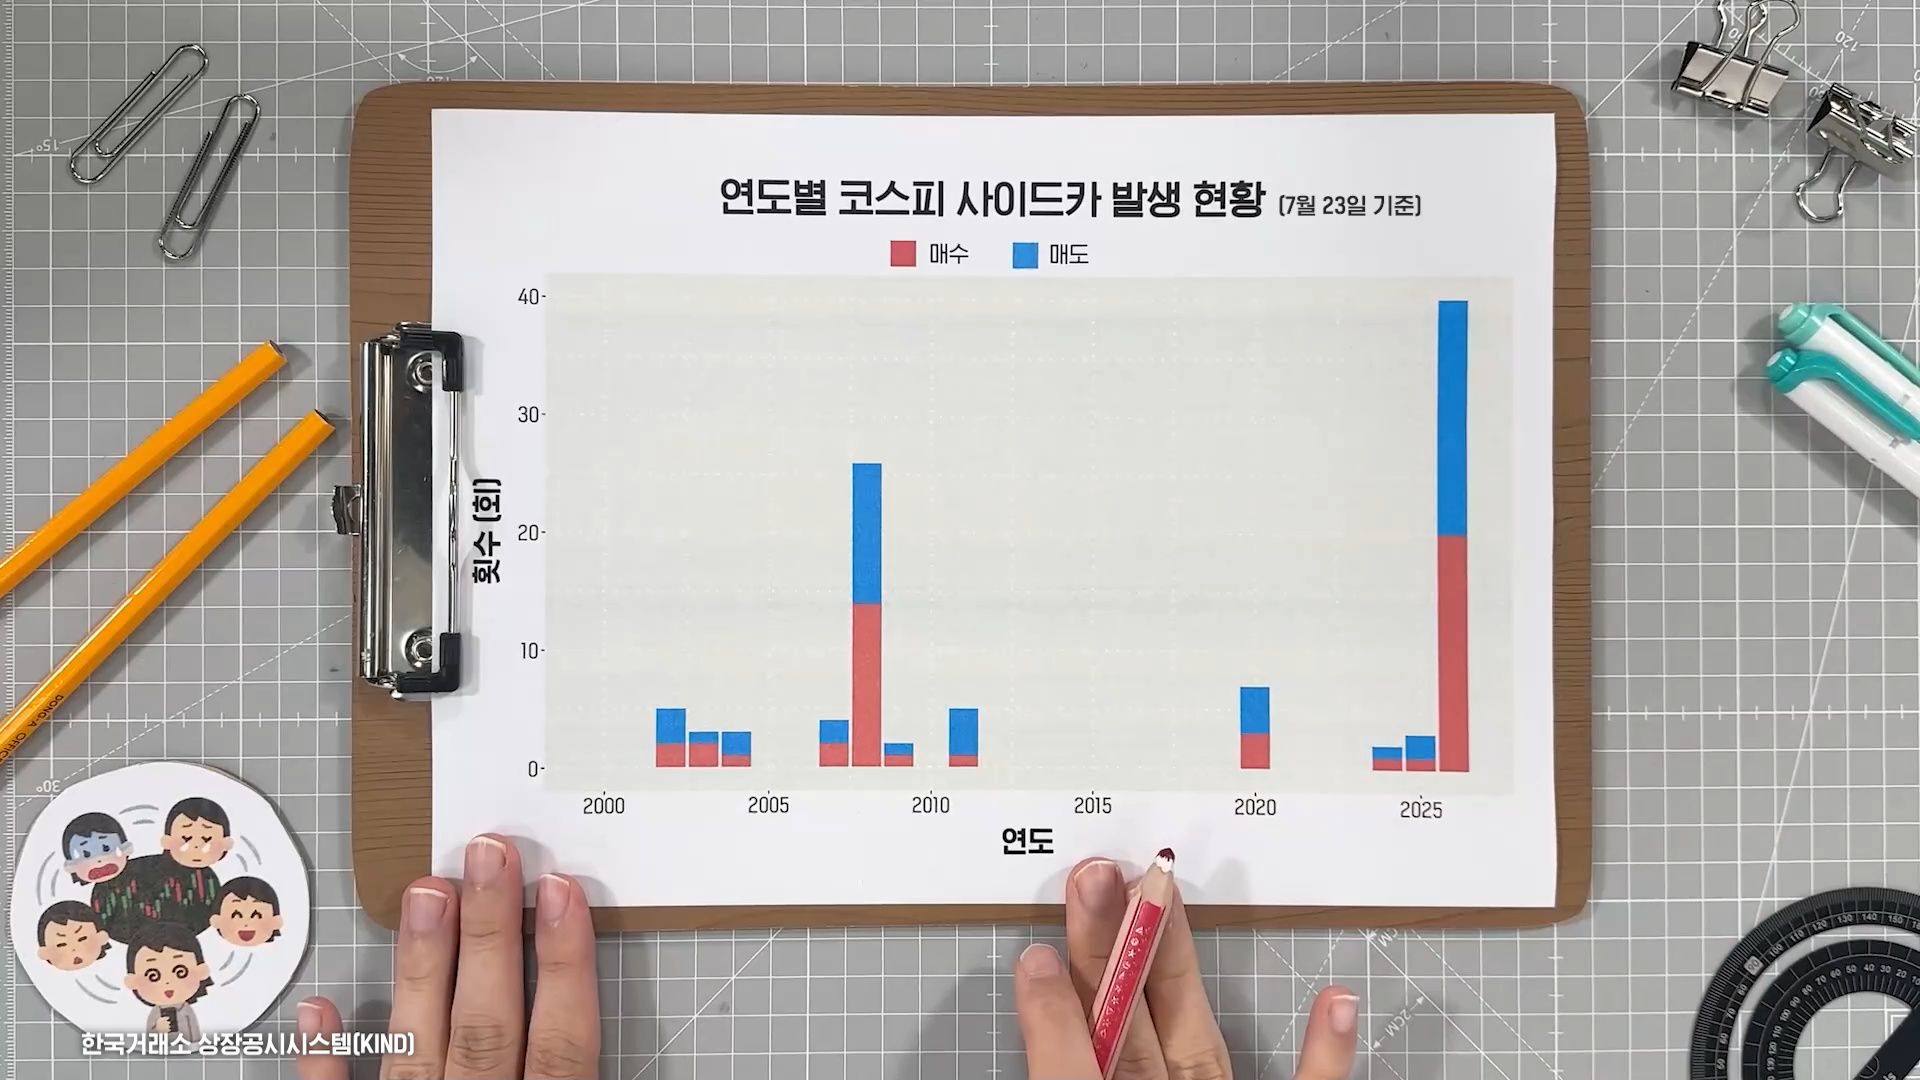
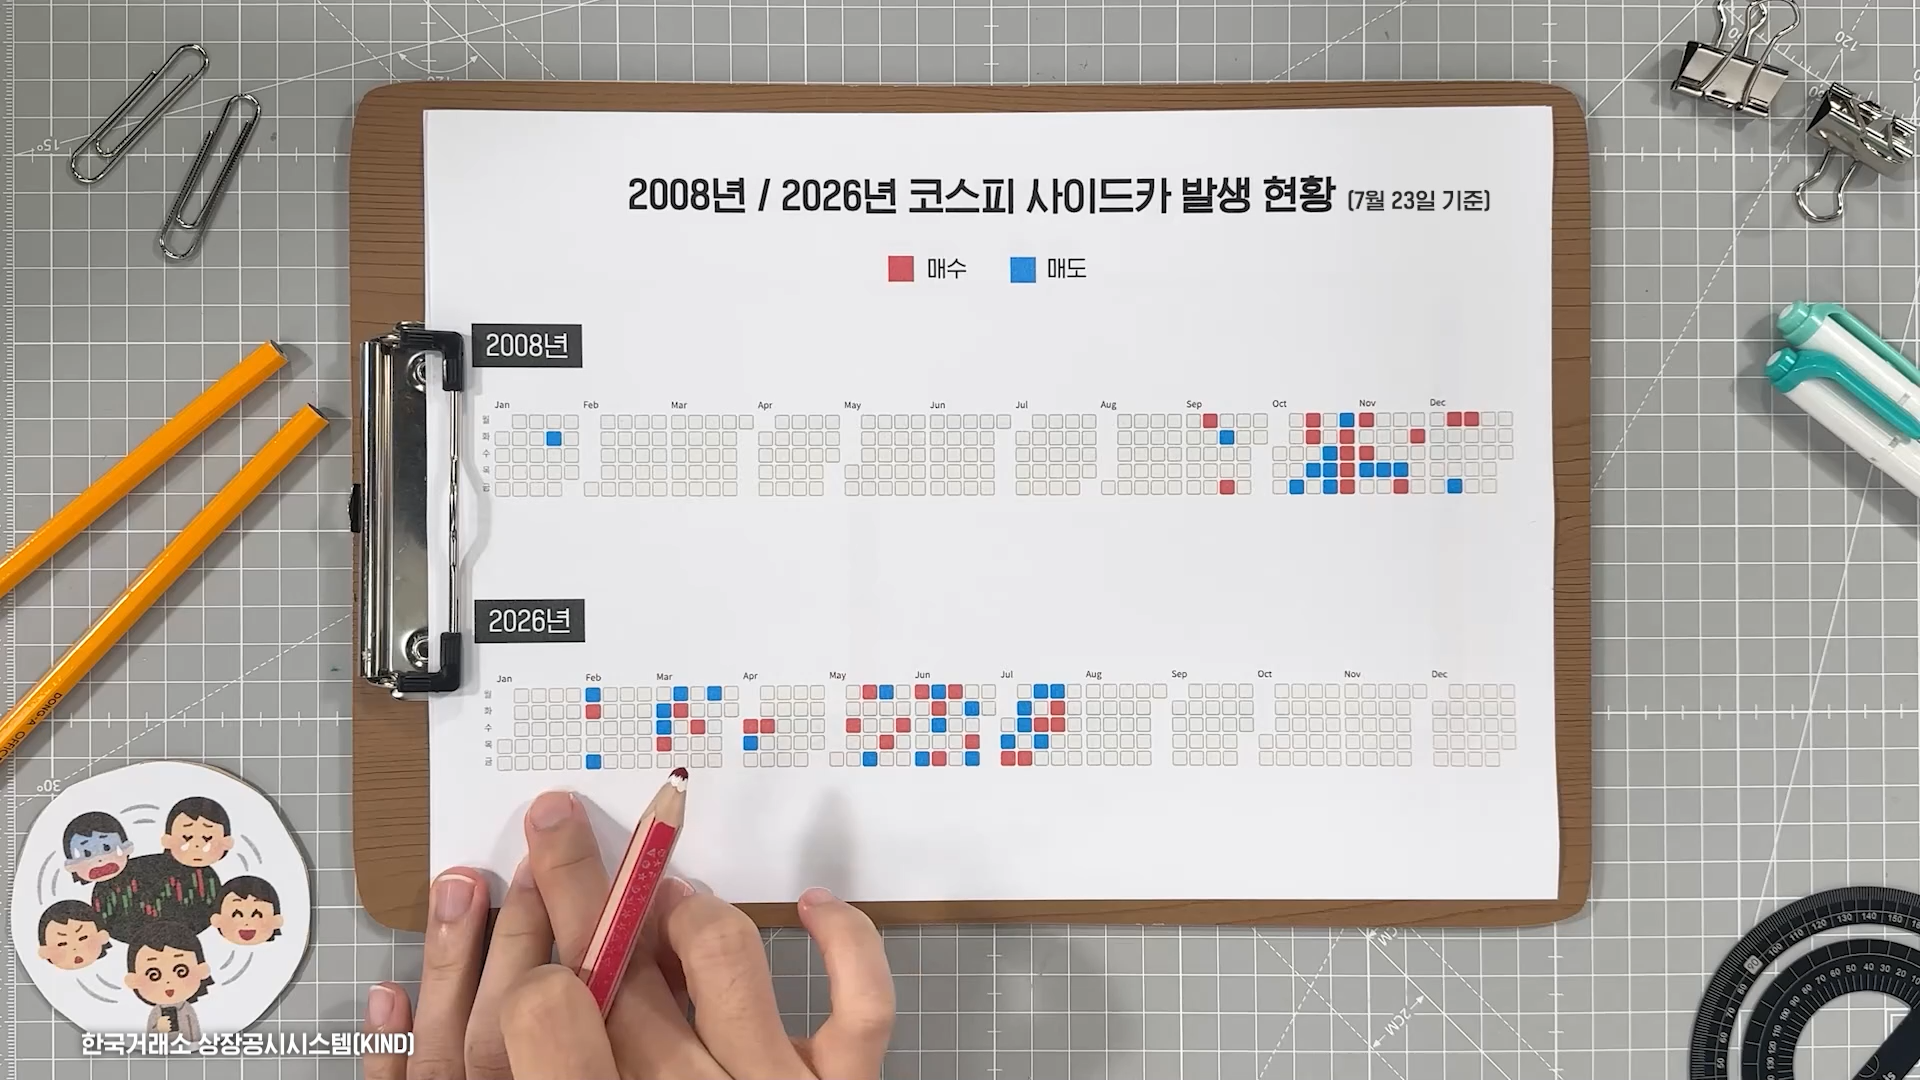
There is a representative index called "KOSPI 200" that tracks the movement of large-cap KOSPI stocks. As its name suggests, it is an index aggregating the market capitalization of 200 stocks listed on the KOSPI with top-tier market cap and trading volume. There is a separate index called V-KOSPI that measures the volatility of the KOSPI 200. A higher number indicates a greater likelihood that the KOSPI 200 will experience large swings.
Similarly, the United States has the VIX index, which measures the volatility of the S&P 500. Let's compare these two indicators.
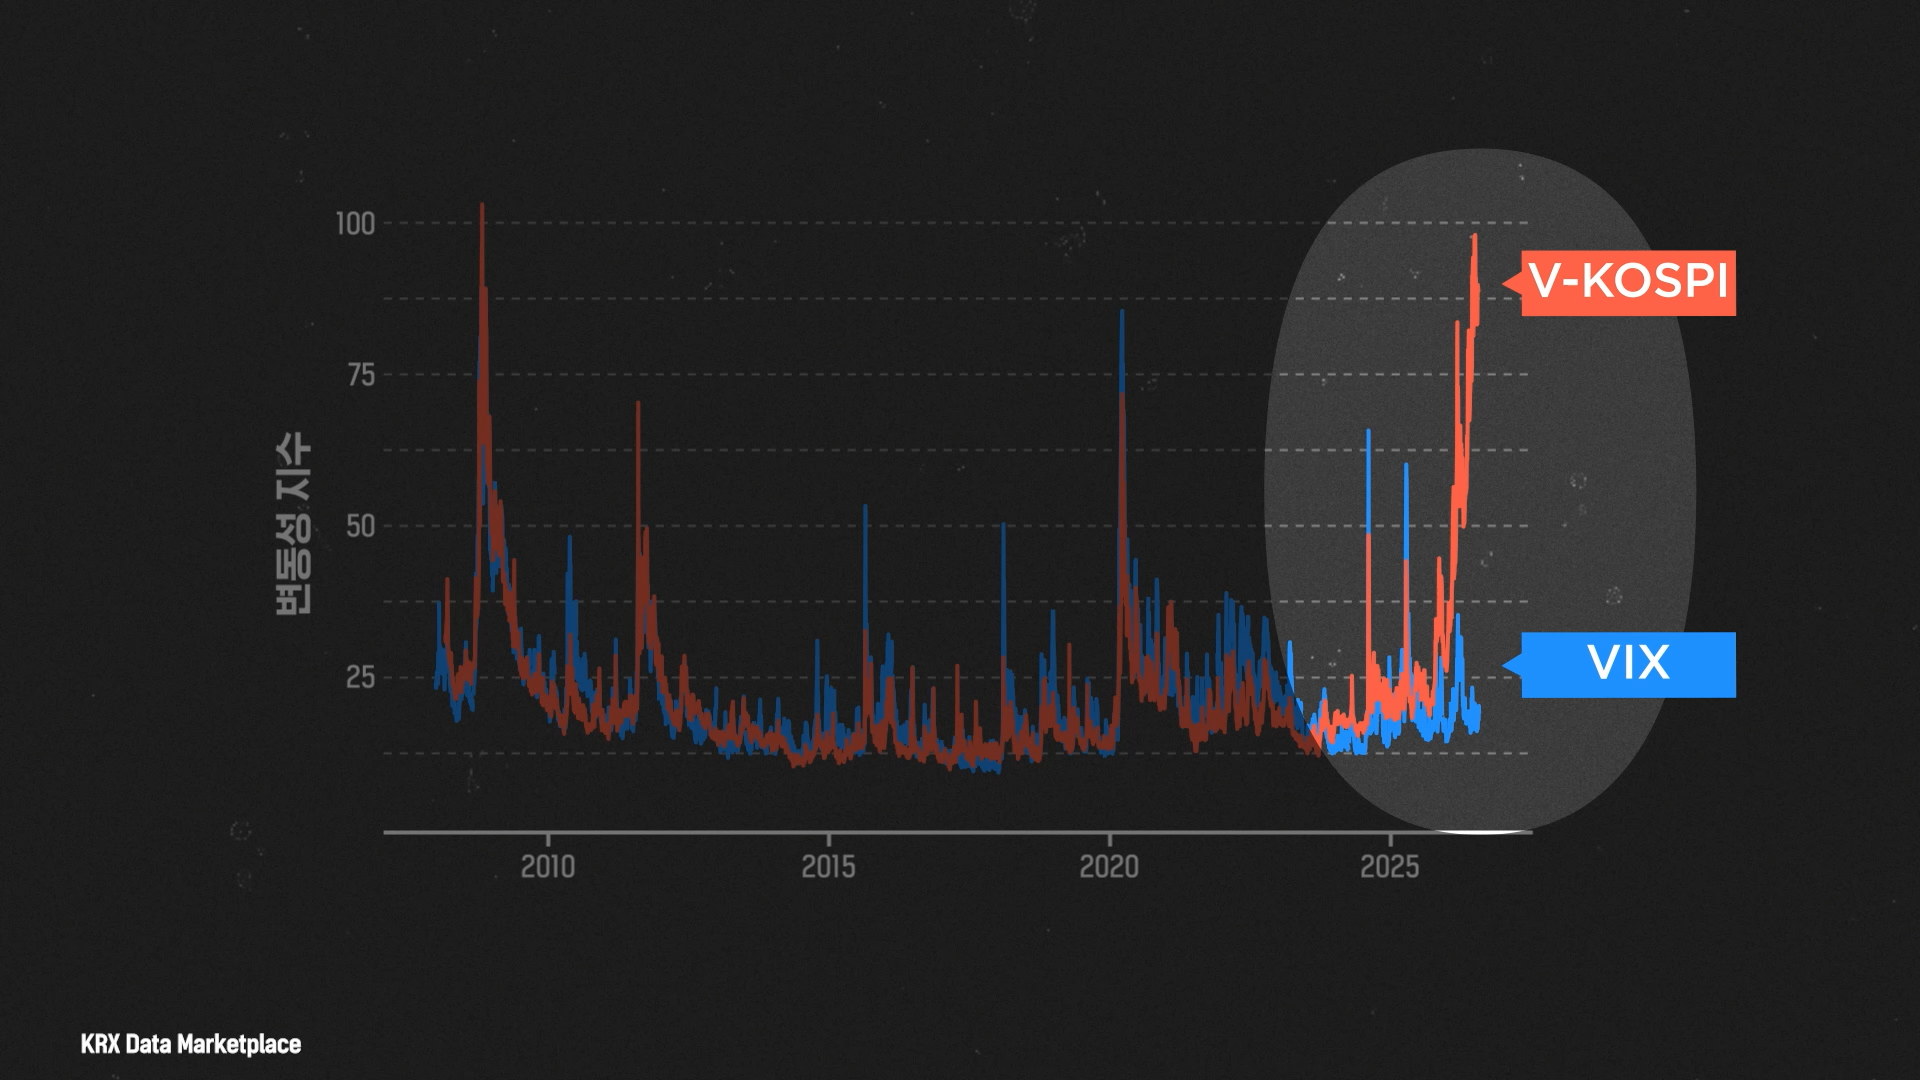
Why is there such a stark difference? To understand the reason, we need to look at the composition of companies comprising the KOSPI 200 and the S&P 500.
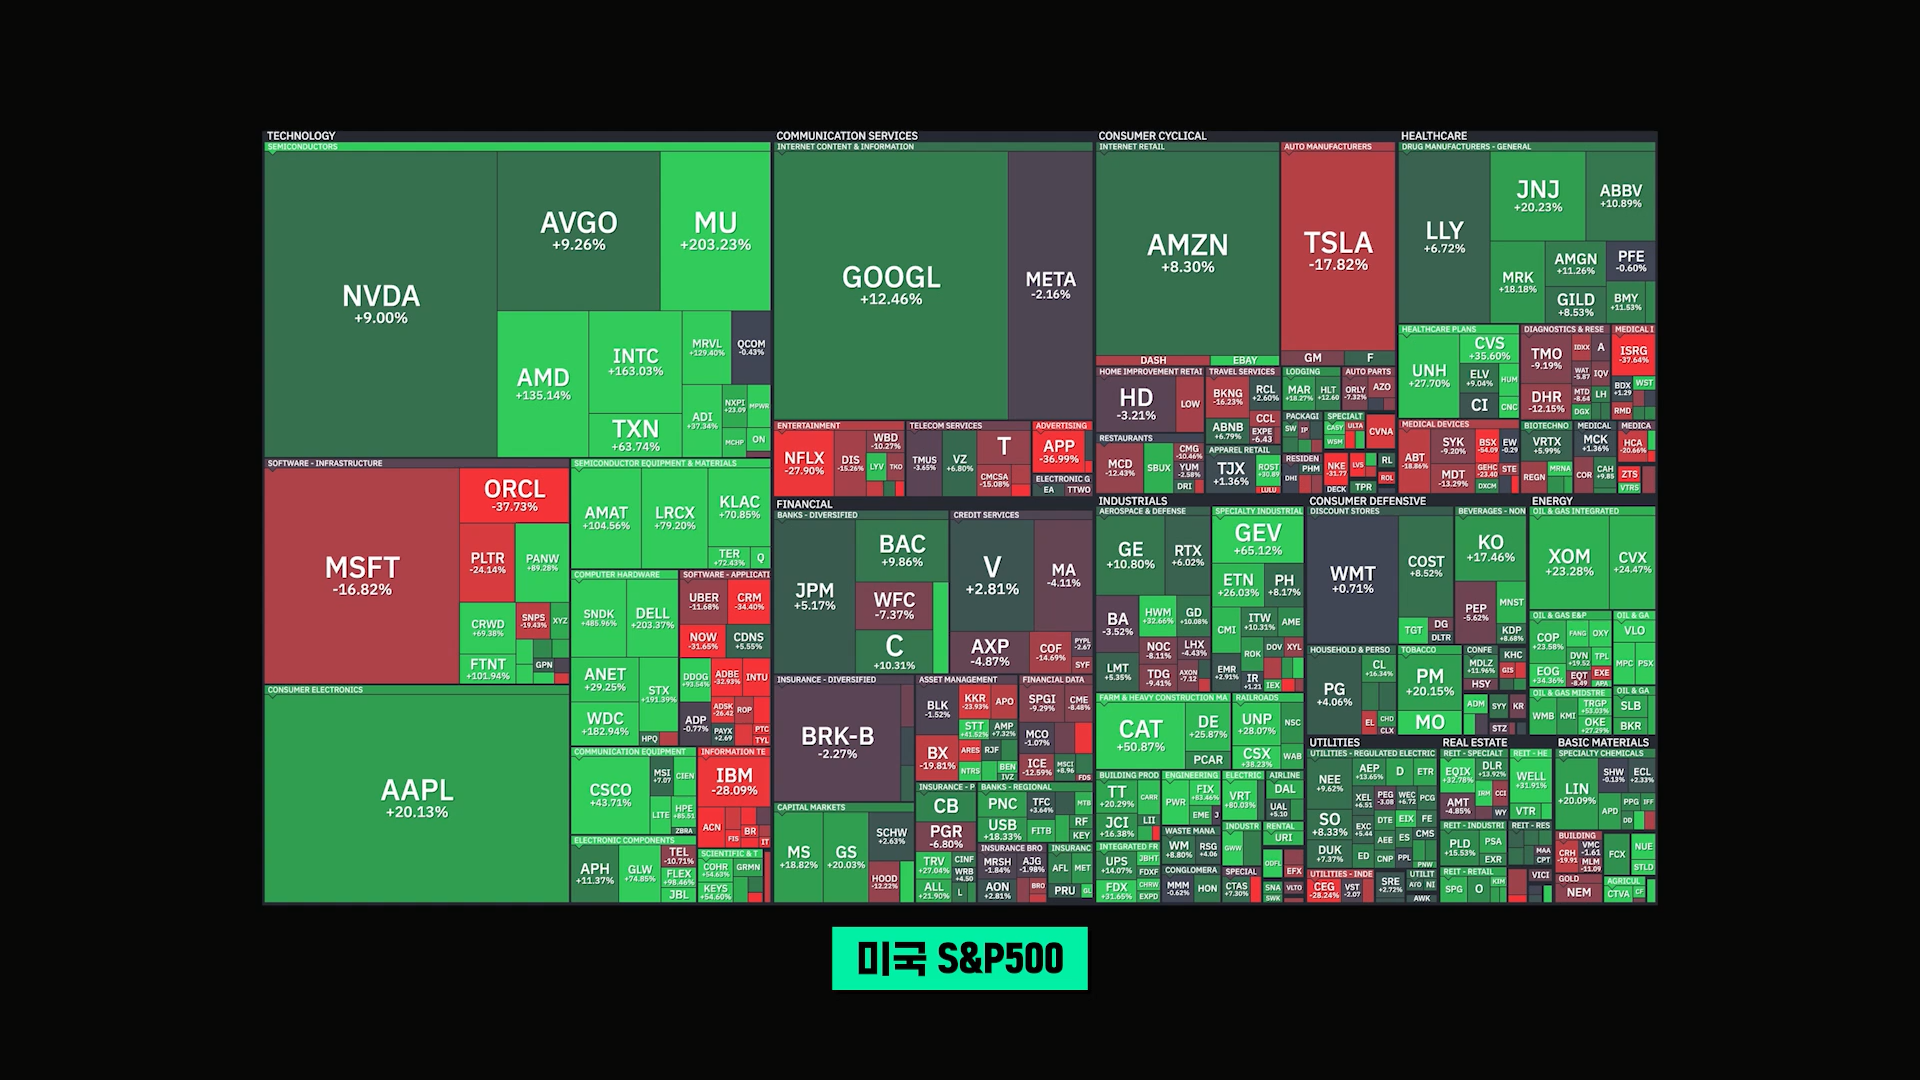
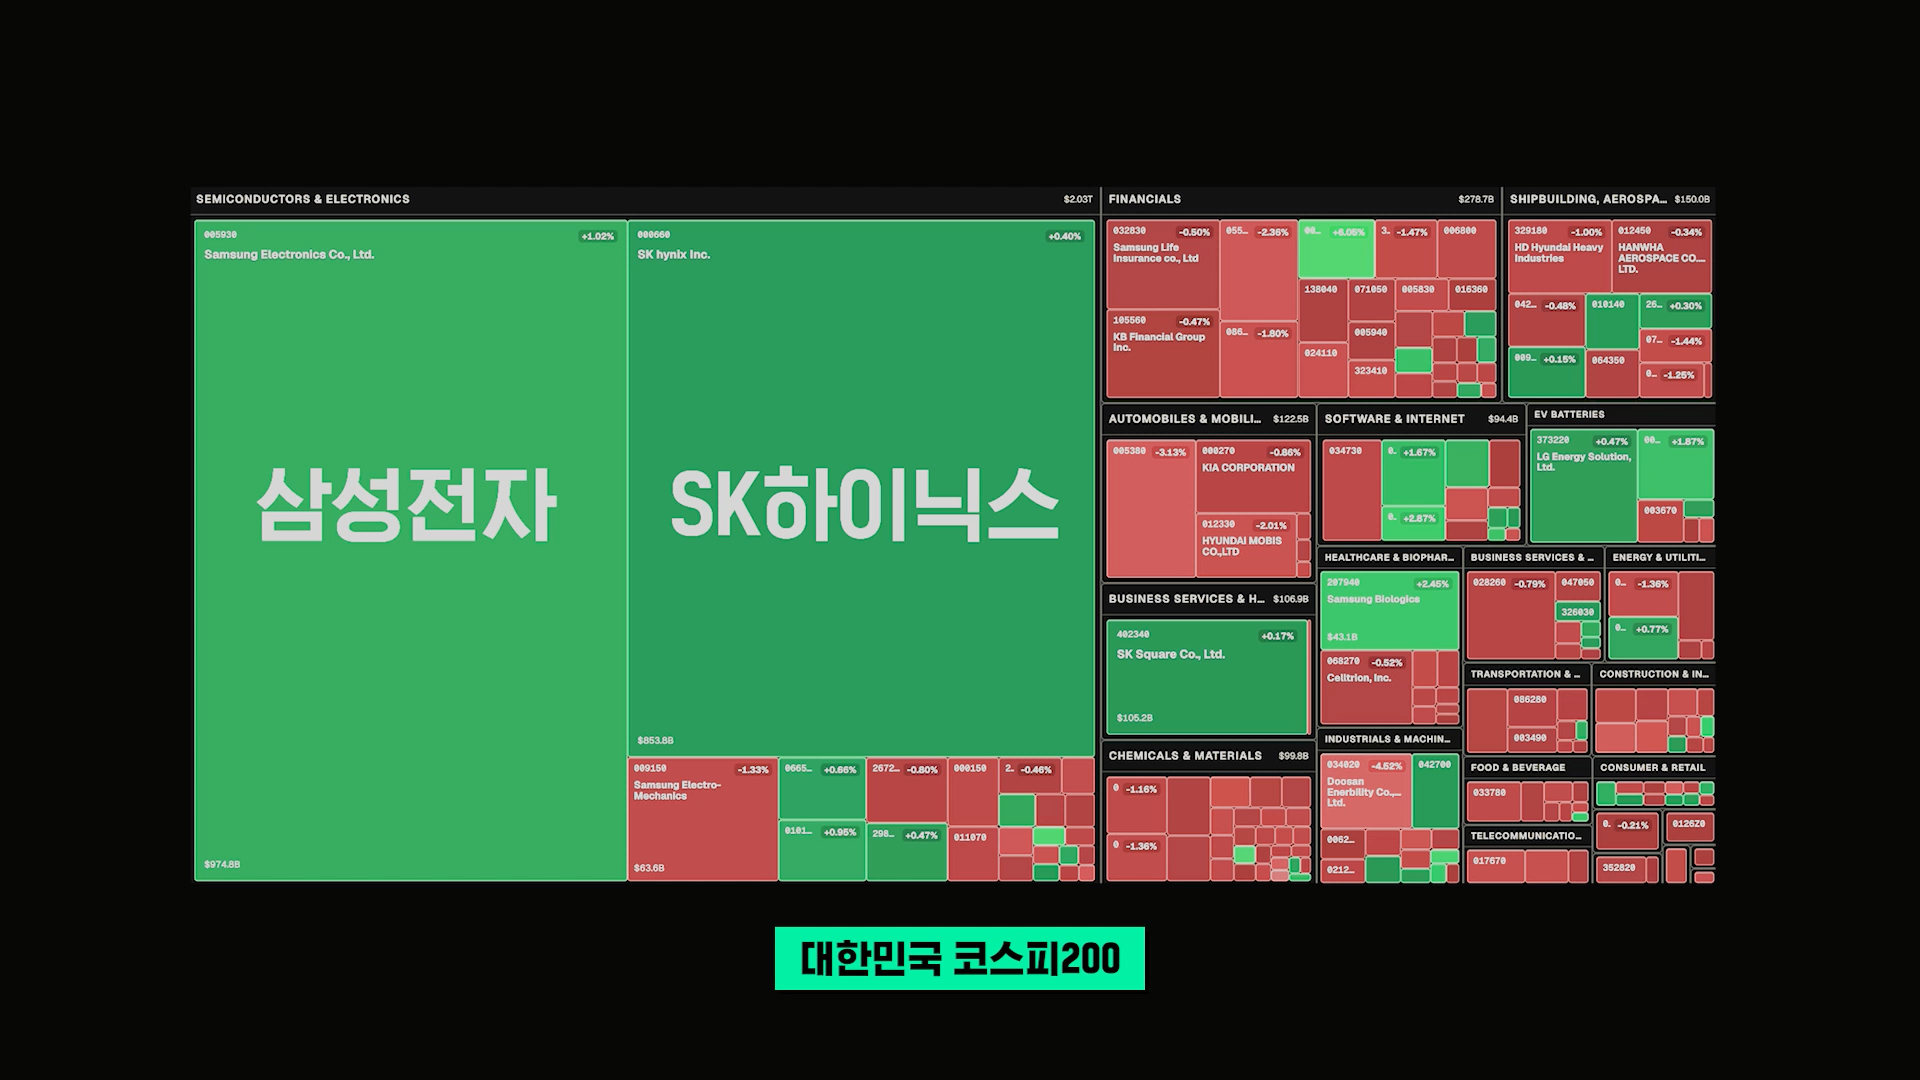
The difference is clear. In the S&P 500, semiconductor companies account for only about 18% of the total. Even if semiconductor stocks swing wildly, other sectors can offset the volatility. In contrast, South Korea's market structure is such that Samsung Electronics and SK Hynix together account for over 50% of the total, meaning shocks to a handful of stocks inevitably spread to the entire market.
With such heavy reliance on semiconductor stocks, critics point out that the launch of single-stock leveraged ETFs has inevitably amplified volatility further. In fact, single-stock leveraged ETFs did not simply appear out of nowhere.
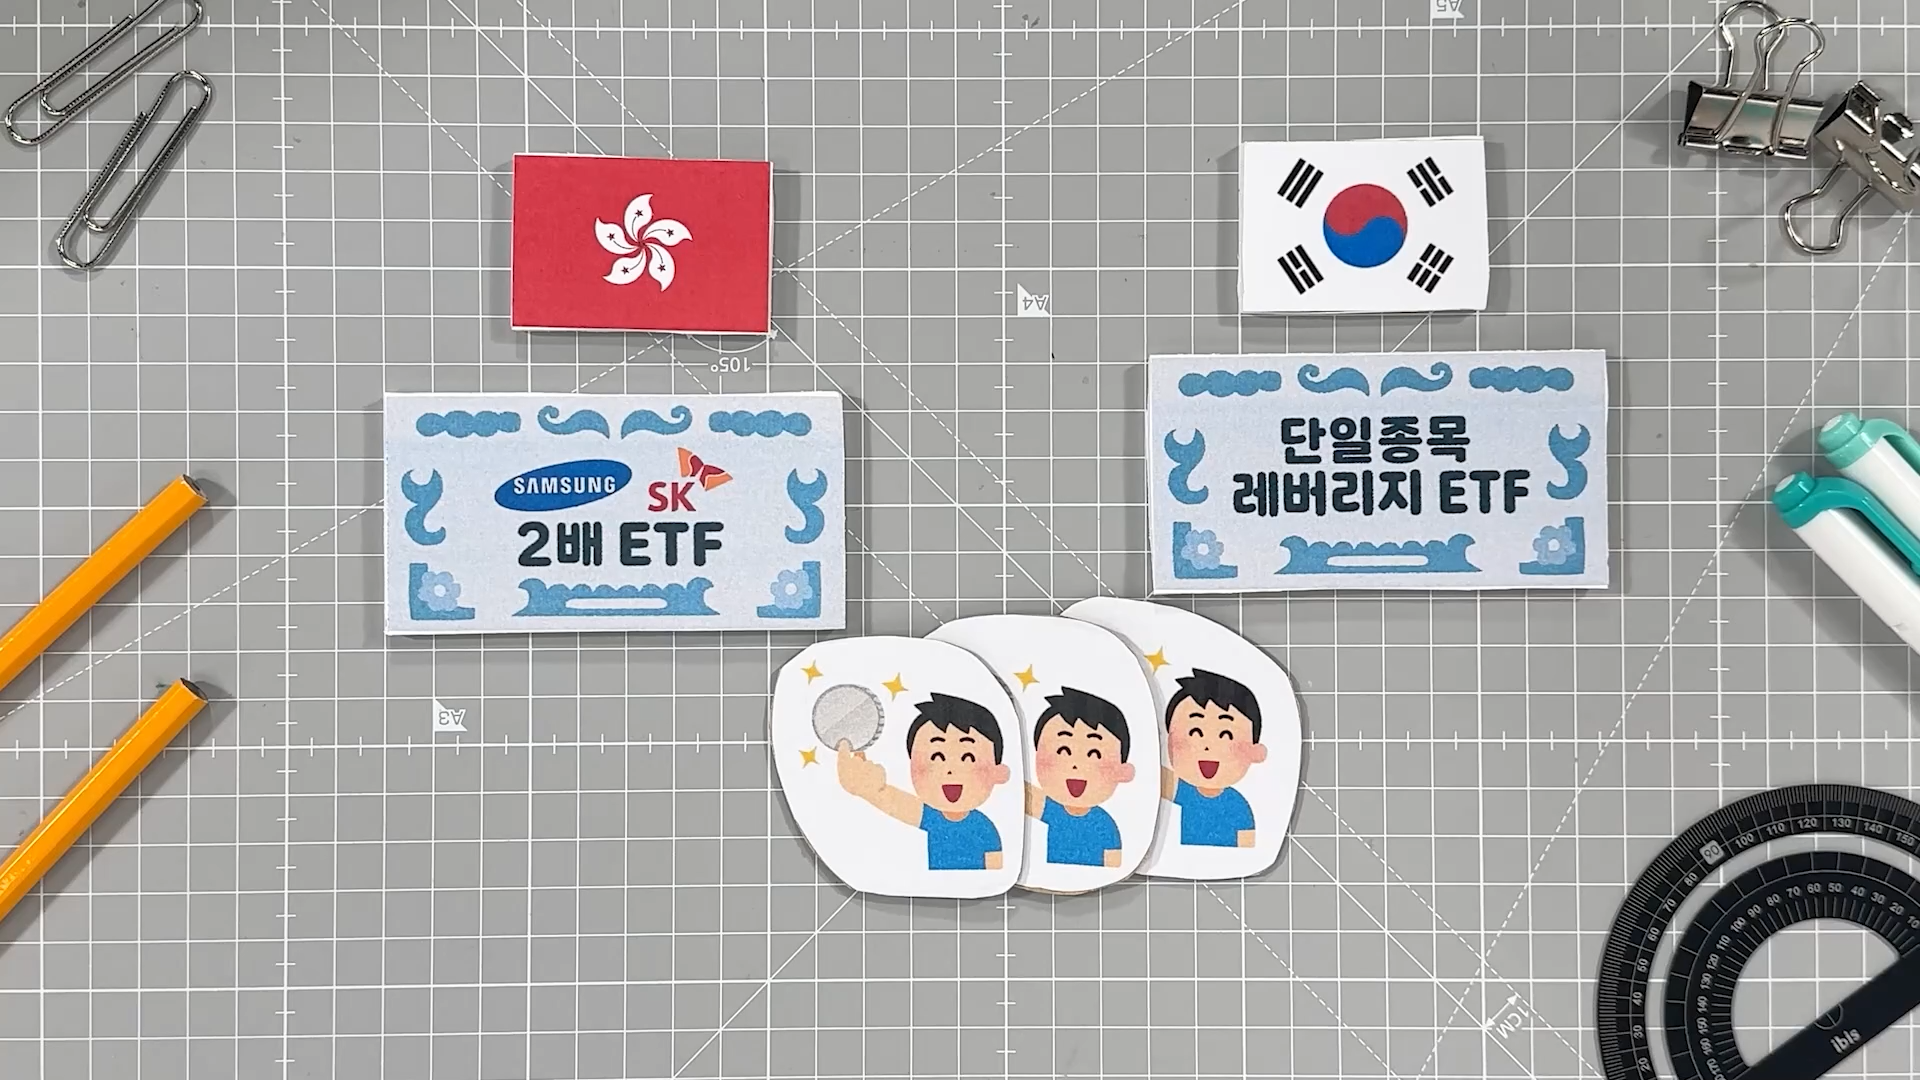
When single-stock leveraged ETFs were listed on May 27, total market capitalization stood at around 4.4 trillion won. Less than two months later, on July 15, that figure surged to 11.9 trillion won. To match daily 2x returns, ETF asset managers must adjust their stock holdings around market close. Naturally, this exerts additional price volatility pressure on the underlying stocks themselves. A "wag the dog" phenomenon occurred, where the tail—the single-stock leveraged ETF—ended up driving the price of the body, the underlying stock.
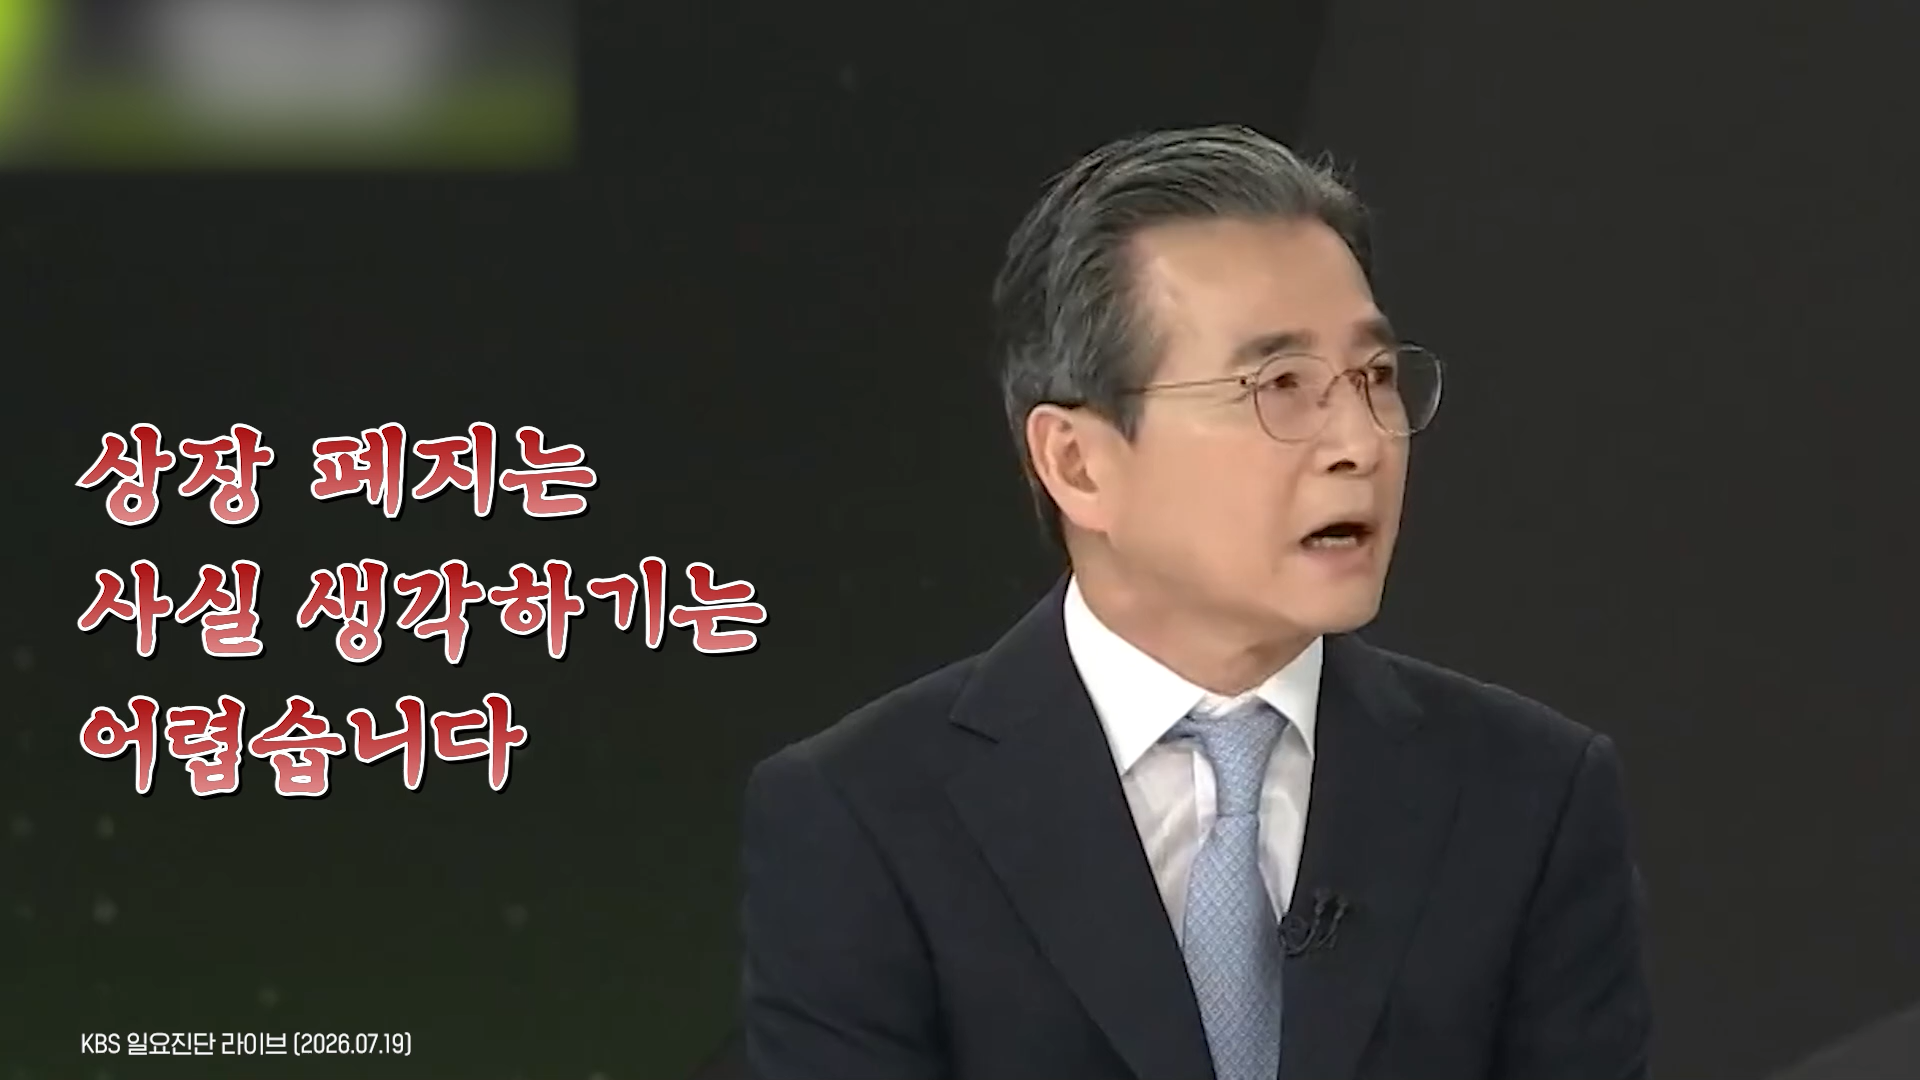
Goldman Sachs analyzed that mechanical selling driven by these single-stock ETFs contributed to the KOSPI's sharp drop. Bae Jae-kyu, CEO of Korea Investment Management—who introduced ETFs to South Korea for the first time and is known as the "father of Korean ETFs"—also posted about the issue on social media. He issued a warning advising against investing in these ETFs, even though they are sold by his own firm. Lee Chan-jin, Governor of the Financial Supervisory Service (FSS), expressed regret during a press conference in June, stating that introducing the ETFs had been rushed.
For now, authorities are devising measures to mitigate market side effects. Starting in August, the minimum deposit requirement for trading single-stock leveraged ETFs was raised to 30 million won in cash, and starting in November, trading will be required in minimum units of 20 shares. Although some argue that these measures are insufficient and that the products should be delisted entirely, the government maintains that delisting is not feasible in the immediate term.
Another Blow? Semiconductor Sector Hit by Moonshot Shock Following DeepSeek
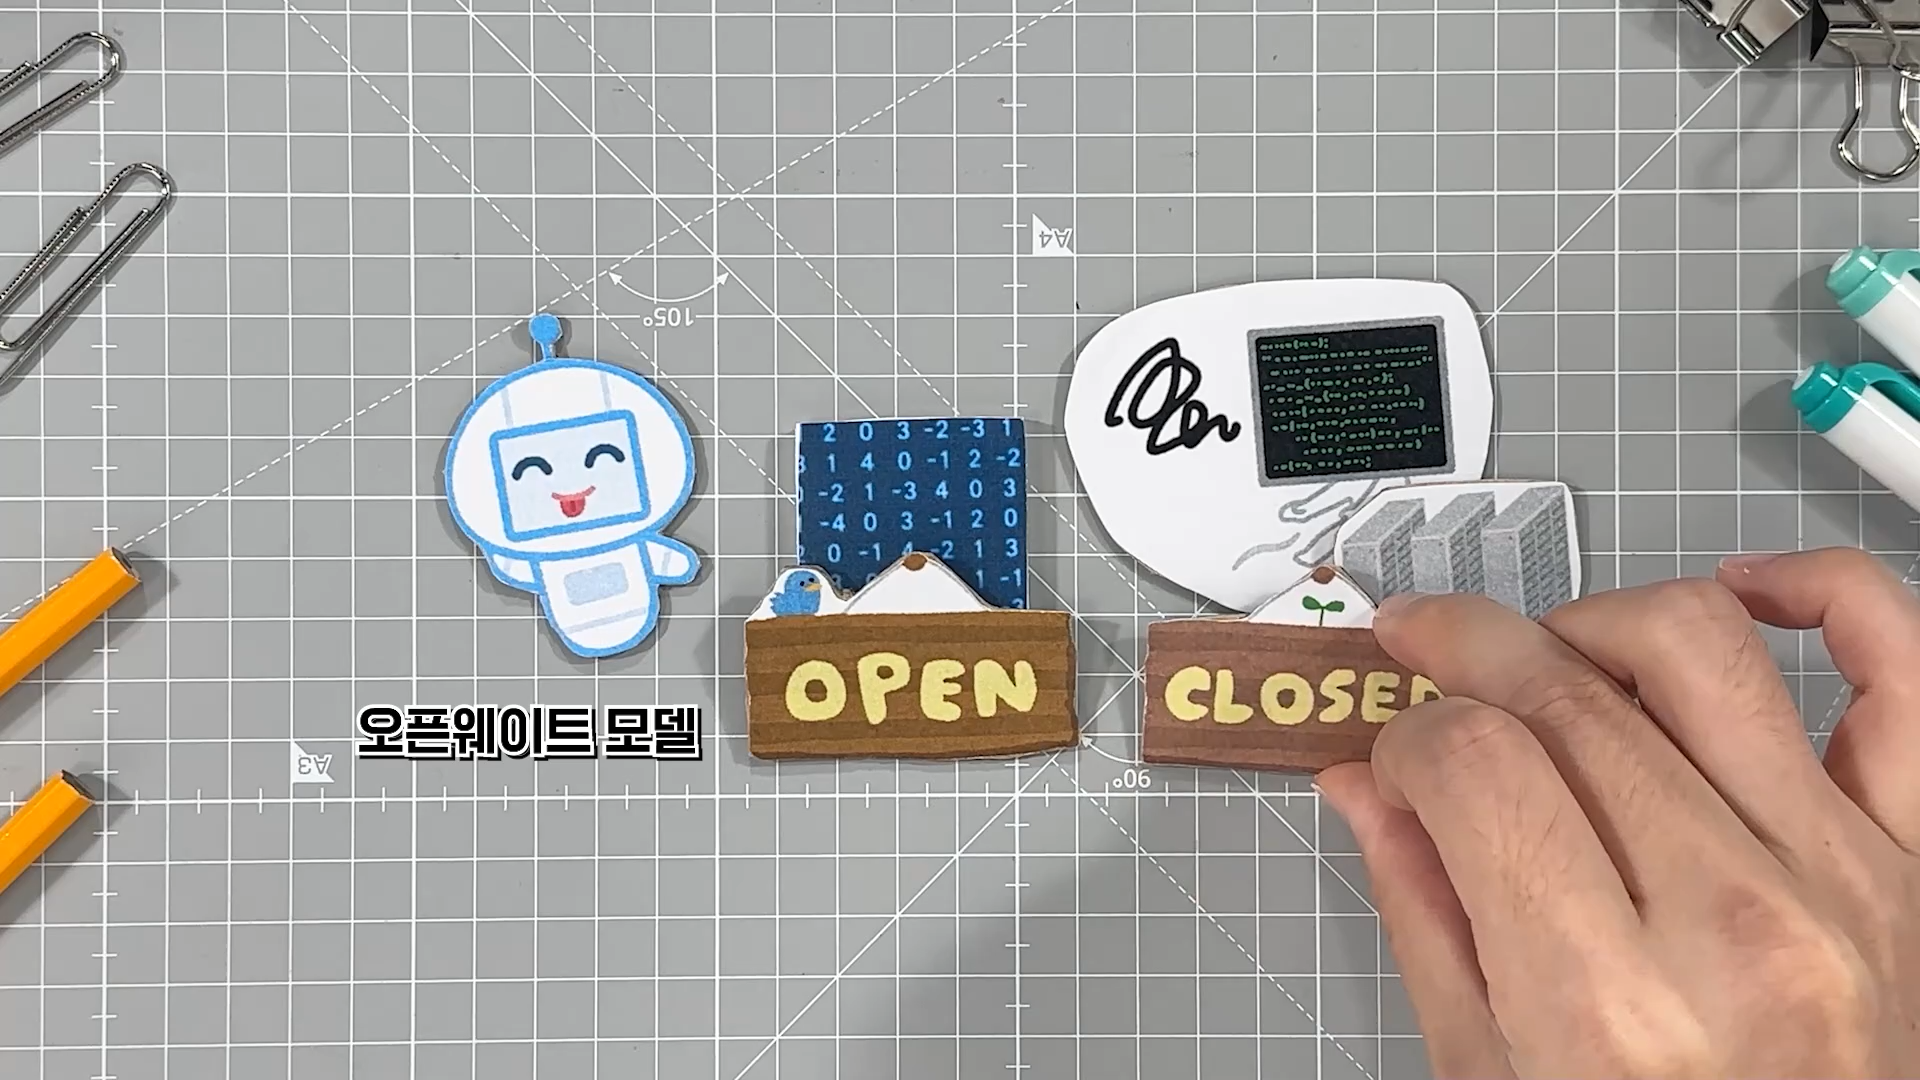
Against this backdrop, on July 16, China's Moonshot AI unveiled K-3, a new version of its language model Kimi. To maximize public attention, the company released it just before the 2026 World Artificial Intelligence Conference in Shanghai. The K-3 model boasts an impressive 2.8 trillion parameters, making it the largest among open-weight models. Compared to the previous K-2 model, which had 1 trillion parameters, it grew nearly threefold.
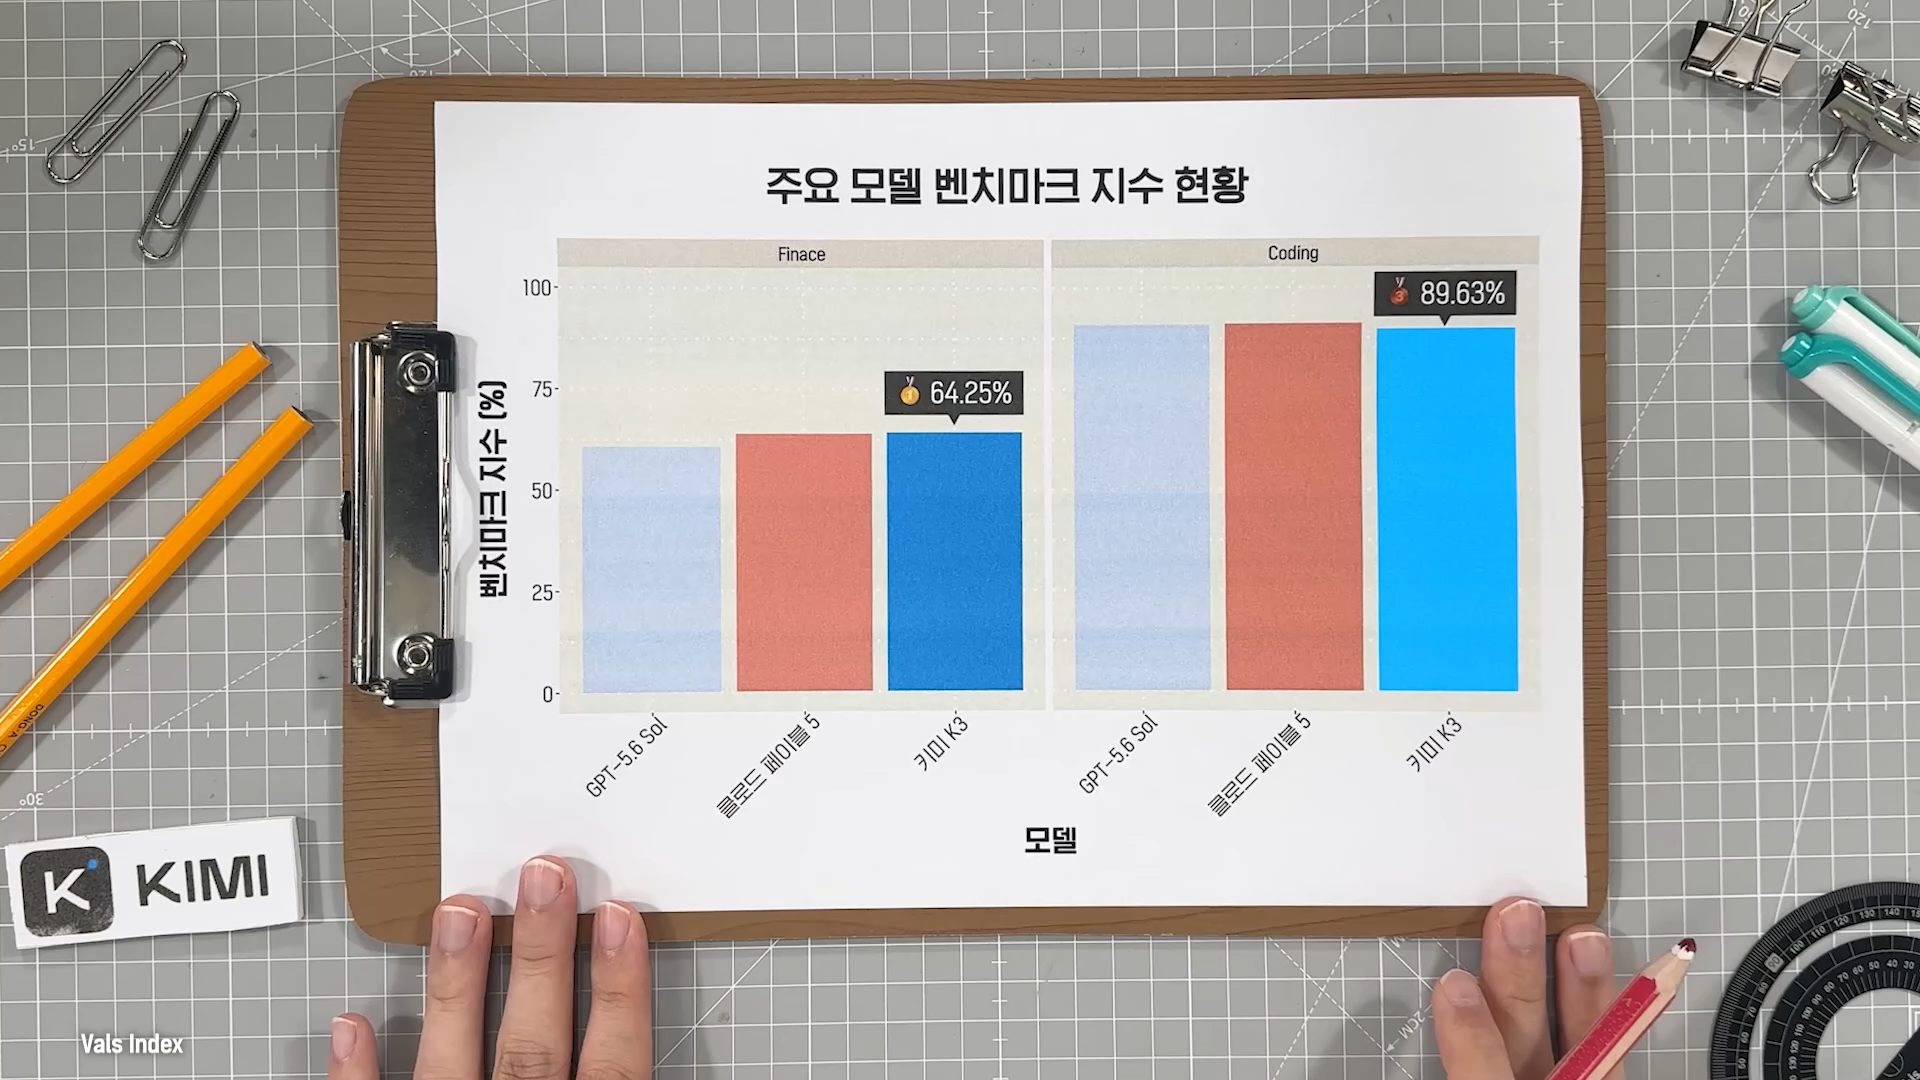
The reason people went wild over K-3, however, was its formidable performance.
Once such a high-performing model was released, users flooded in at an explosive rate. Due to the massive influx of users, Moonshot AI temporarily suspended new user registrations just three days after launch.
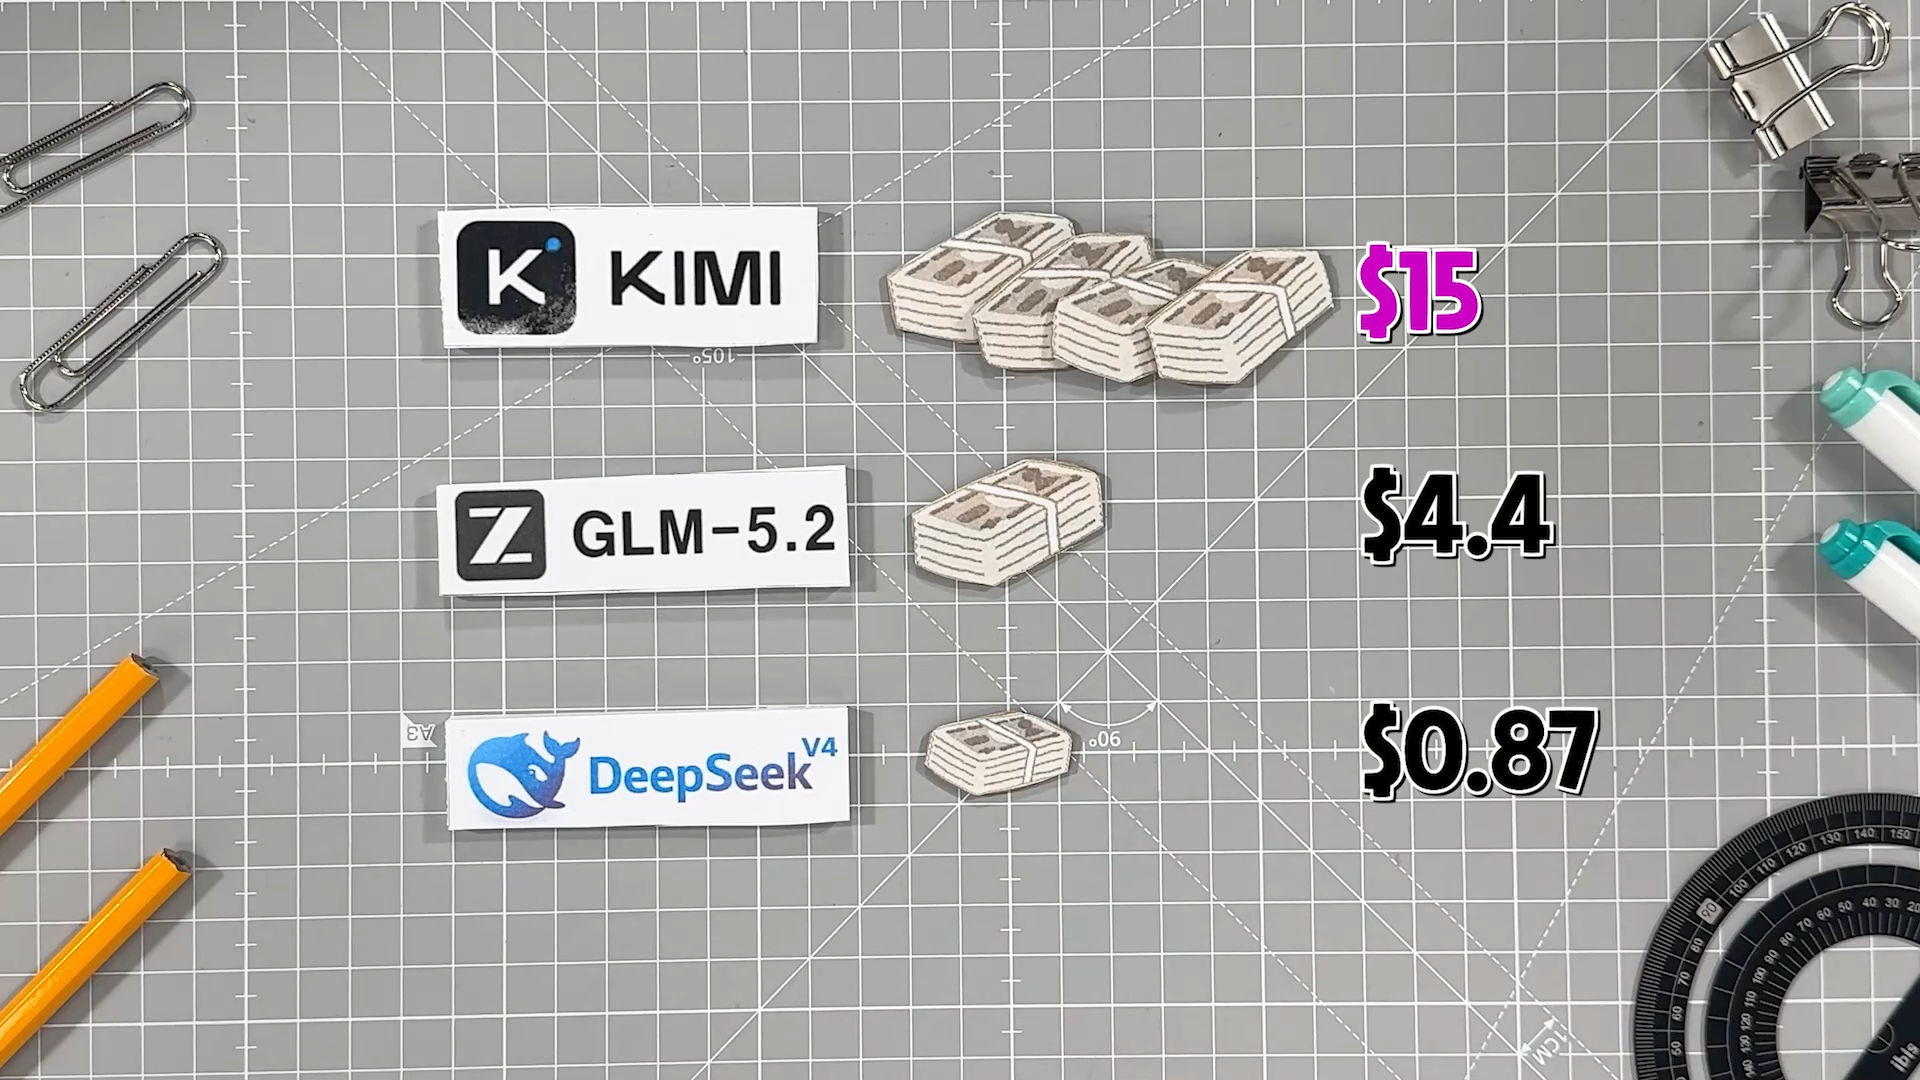
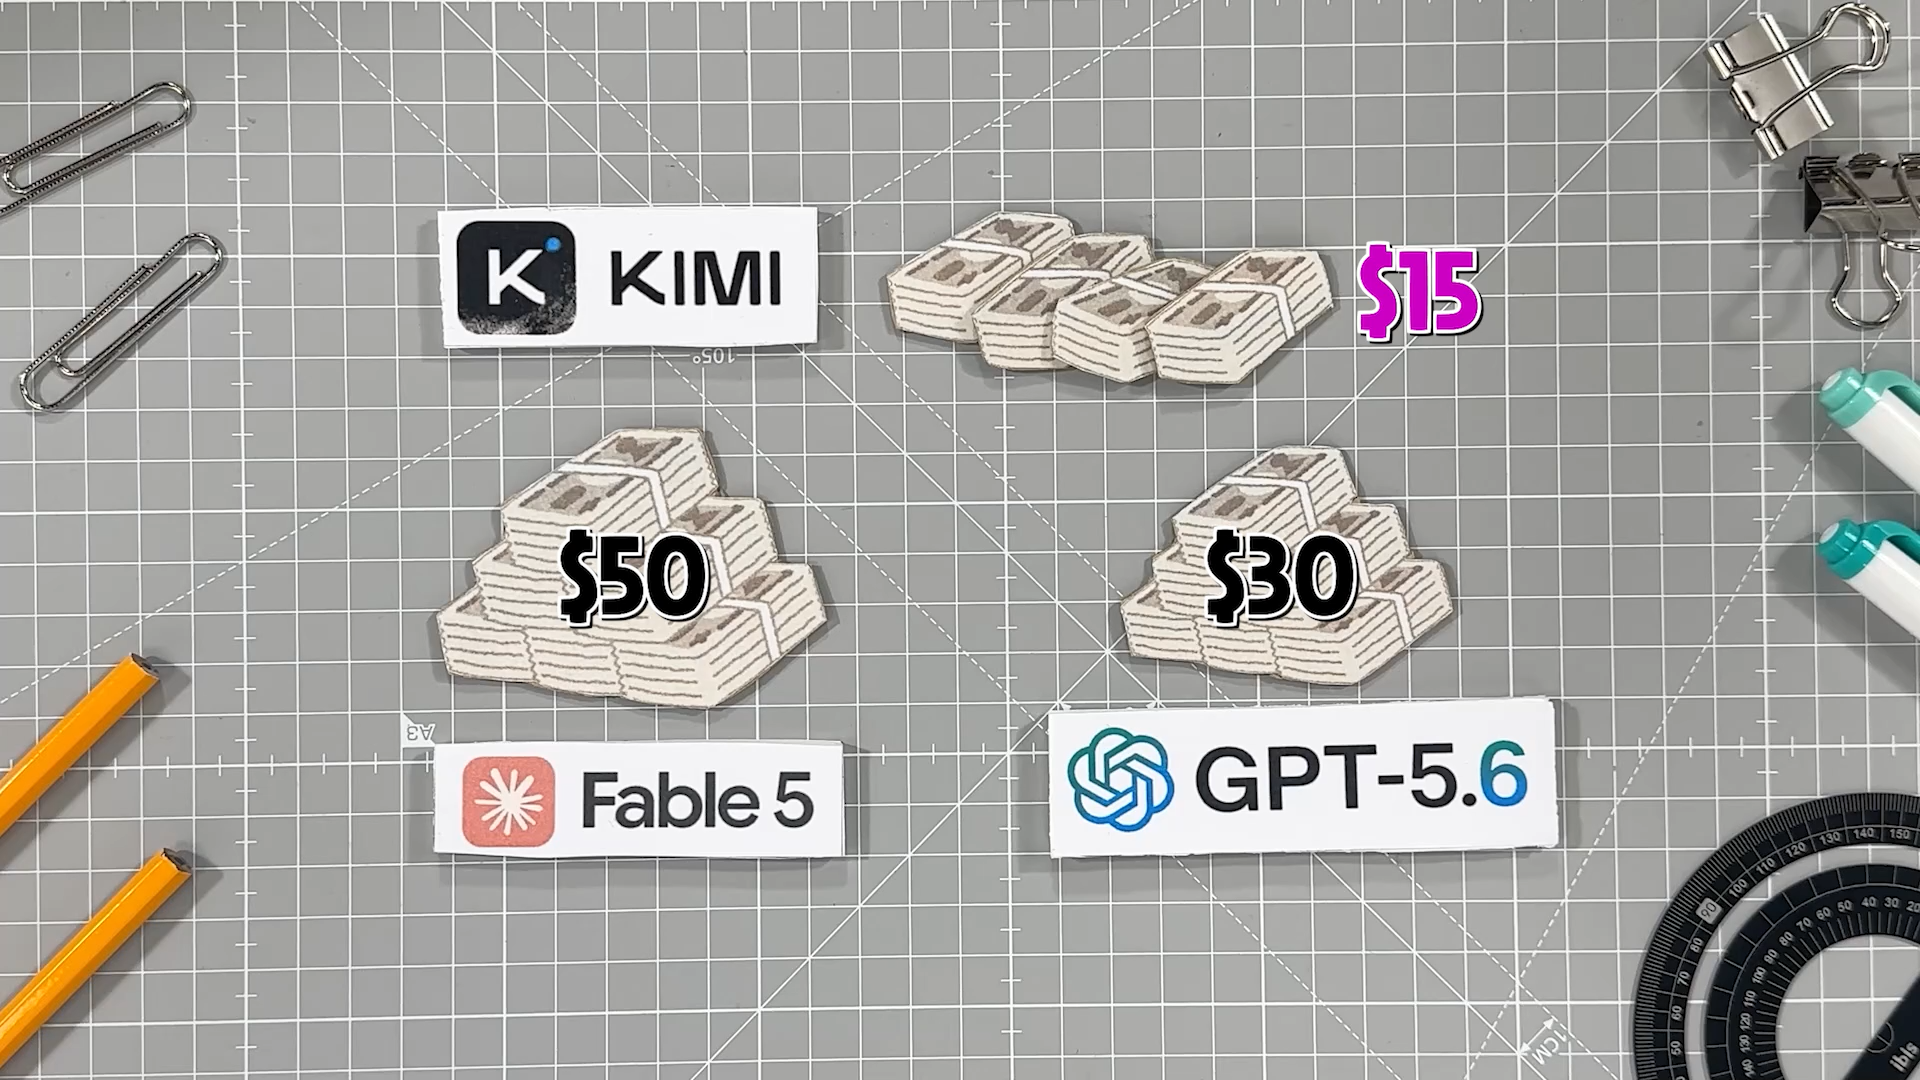
Of course, users could download the weight files and self-host to run it for free, but considering the infrastructure required to run a 2.8-trillion-parameter model, practical operation would be difficult.
In any case, as the Moonshot shock from China hit an already volatile AI semiconductor market, stock markets suffered another blow. From an investor's perspective, with affordable Chinese models offering performance comparable to U.S. models, questions naturally arose over whether big U.S. tech investments make sense. Doubts emerged about whether the gap created through infrastructure investments is sustainable, which inevitably impacts chipmakers supplying that infrastructure. The day after the K-3 model was revealed, U.S. semiconductor stocks dropped across the board. The Philadelphia Semiconductor Index plunged 12.5% that week, posting its worst weekly performance in 15 months.

This is because when highly efficient and cheap models become available, more companies will accelerate AI adoption, and more people will use them. This will inevitably increase the need for AI data centers handling inference computation. Naturally, this serves as a positive driver for companies making semiconductors designed for AI data centers.
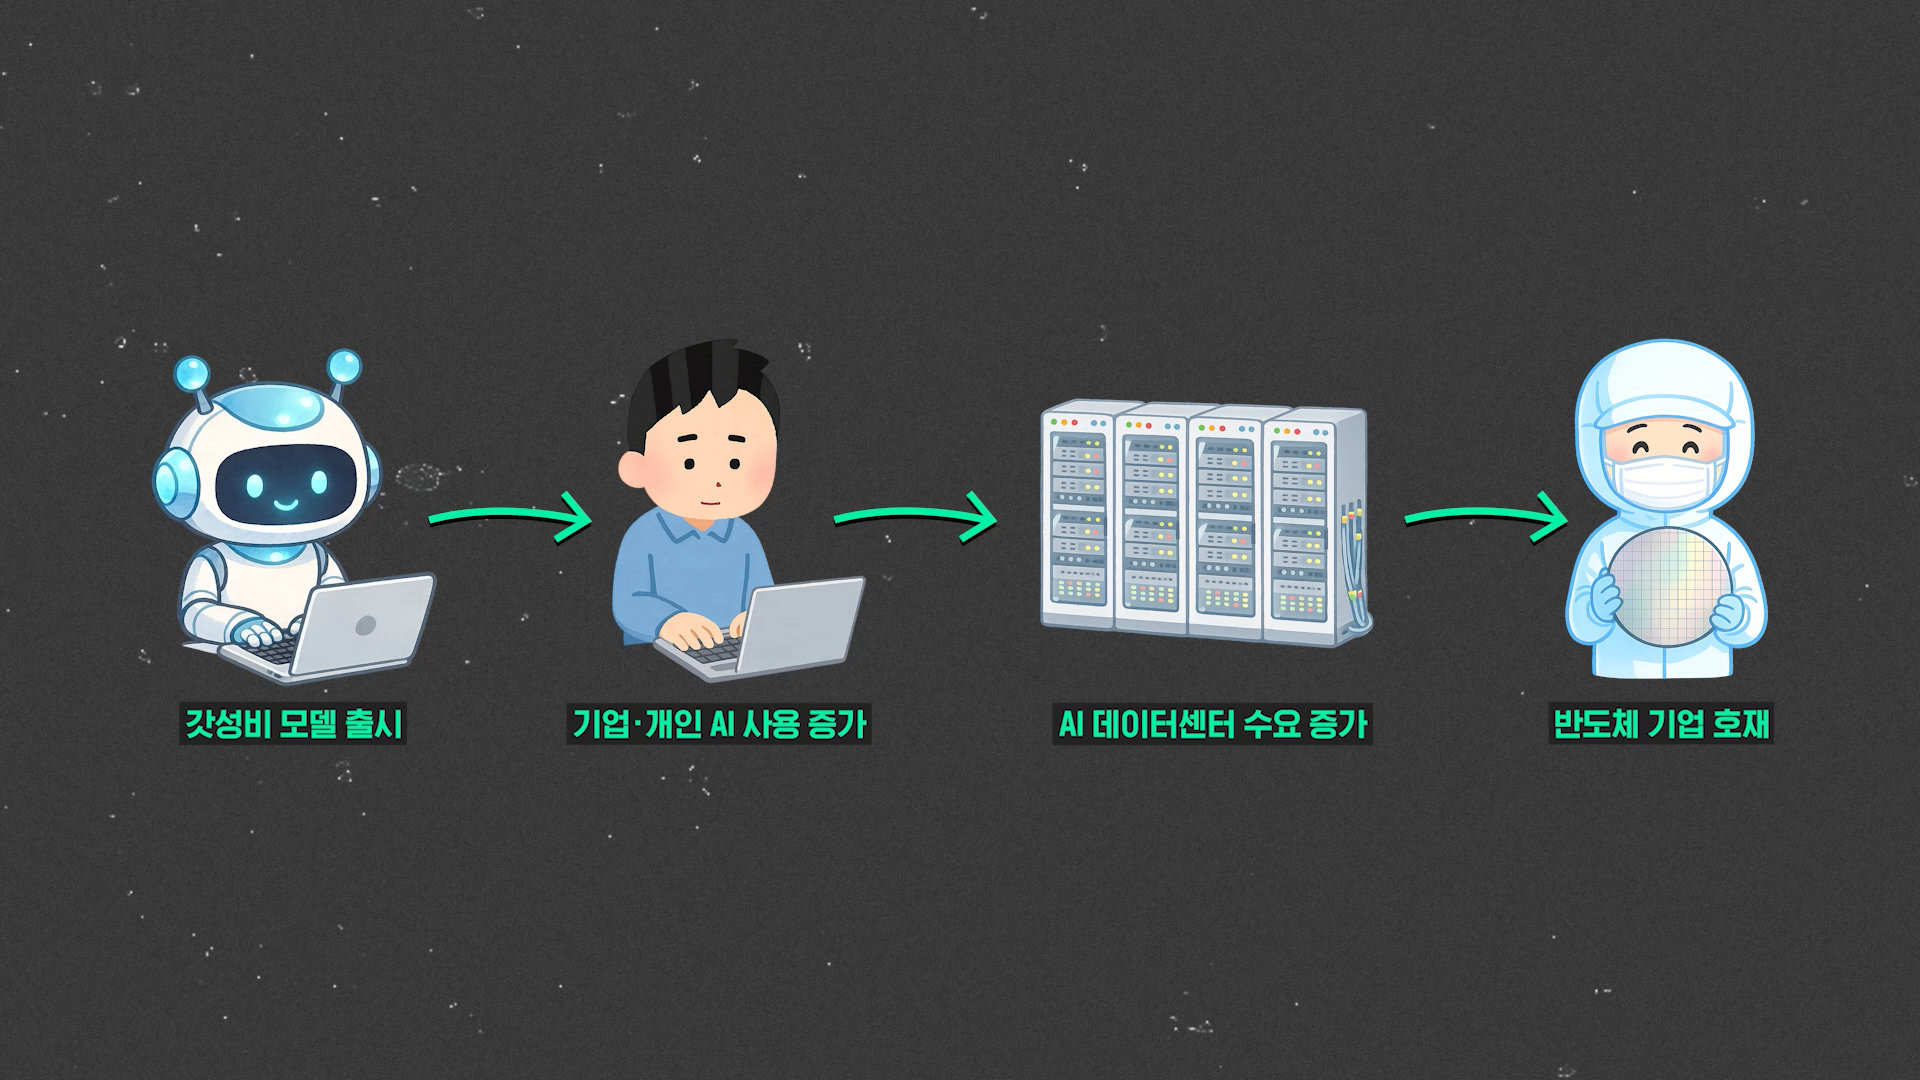
Still, no one can guarantee that the market will head toward a rosy outcome based solely on this demand. The AI and semiconductor markets will likely continue through periods of valuation re-assessment and price adjustments.
Even with record-setting earnings, the market continues to fluctuate, compounded by shocks from China. As the July earnings season draws to a close, market uncertainty is unlikely to subside easily. Nevertheless, given that some companies are backed by solid earnings, taking a longer-term perspective may be warranted. That concludes today's OhGraph. Thank you very much for reading this long article to the end.
References
- Q2 2026 Earnings Release | SK Hynix
- Samsung Electronics Annual Revenue, Operating Profit, and Operating Profit Margin | Samsung Electronics
- Q2 2026 Earnings Release | TSMC
- Annual KOSPI Sidecar Activation Status | Korea Exchange KIND
- V-KOSPI Index Status | KRX Data Marketplace
- S&P500 stock Heatmap | finviz
- KOSPI: Testing Key Technical Support Levels | Goldman Sachs
- June 2026 FSS Press Conference - Volatile Stock Market... Stabilization Measures [Sunday Diagnosis Live] | KBS News
- Vals Index | Vals AI
- WebDev Code Arena | Arena AI
- Kimi.ai(@Kimi_Moonshot) | X
- Open frontier model size over time | Kimi Platform
Written by: An Hye-min Design: An Jun-seok Intern: Shin Yeon-sung
※ Please note: This article was translated by AI and may contain errors.
Copyright Ⓒ SBS. All rights reserved. Unauthorized reproduction, redistribution, and use for AI training are prohibited.